Download PDF
Download page Plotting Velocity.
Plotting Velocity
RAS Mapper has the ability to plot velocities spatially for both 1D river reaches and 2D flow areas. Velocity is plotted with a color palette reflecting the magnitude of the velocity. Users can change the color palette, as well as the magnitude range for plotting the colors. Velocity vectors, which reflect direction and magnitude of the velocity, can be added to the plot. Additionally, there is an option to turn on a particle tracing visualization, which allows for much greater understanding of the velocity flow field, in both magnitude and direction.
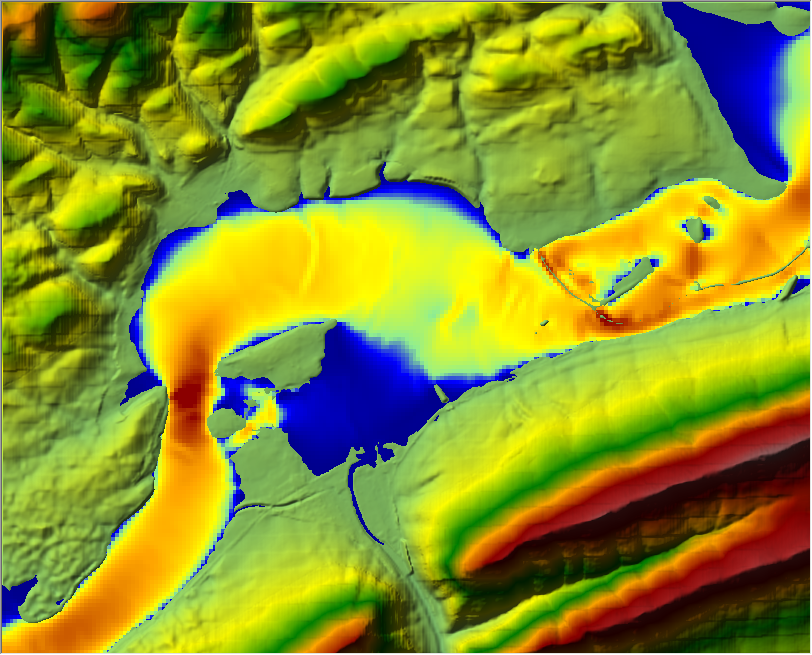
Turn on the velocity output layer by checking the box to the left of the layer. From there the user can make the Velocity layer the active layer (highlighted in pink) and select the Animation tool to animate the entire flood event. See an example 2D model Velocity plot in the Figure 6-12 below. 
![]() In addition to color velocity plotting, RAS Mapper has the option to add velocity vectors and show particle traces on top of the map layers. To add velocity vectors, press the Static Velocity Arrows button above the map window. This will turn on the velocity direction and magnitude arrows. To control the density of the arrows, select the Velocity Setting button
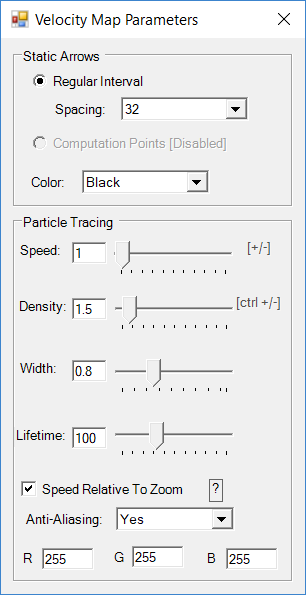
In addition to color velocity plotting, RAS Mapper has the option to add velocity vectors and show particle traces on top of the map layers. To add velocity vectors, press the Static Velocity Arrows button above the map window. This will turn on the velocity direction and magnitude arrows. To control the density of the arrows, select the Velocity Setting button ![]() above the map window. This button will bring up the window shown in Figure 6-13 below:
above the map window. This button will bring up the window shown in Figure 6-13 below:
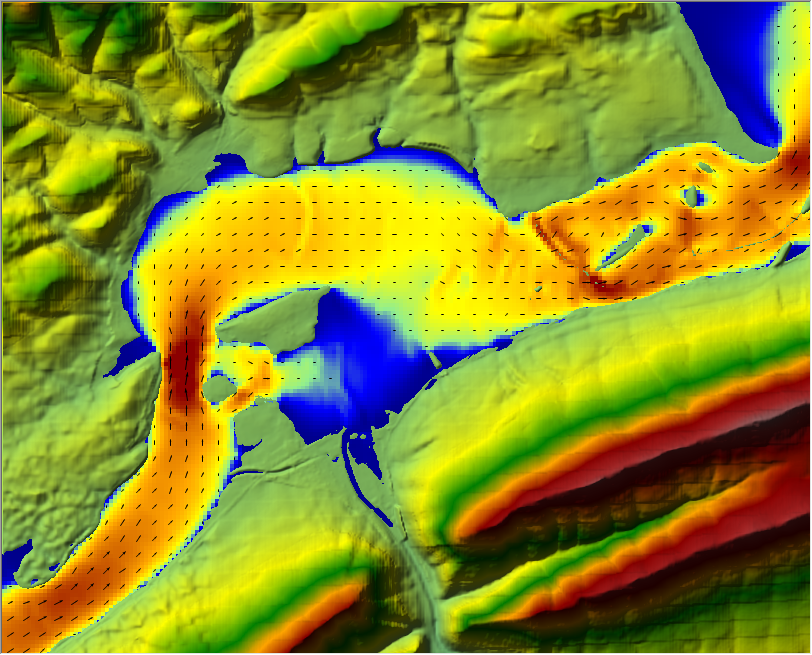
The Velocity Map Parameters settings window (see Figure 6=-13) allows the user to control the spacing between arrows by selecting a Spacing (pixel width for the spacing between arrows). When the arrows are turned on, they are displayed in the direction of the velocity. The magnitude of the velocity is reflected in the size of the arrows (i.e. larger arrows equates to higher velocity). Show in Figure 6-14 is a velocity plot with magnitude/direction arrows turned on.
Another extremely cool option for velocity plotting is the option called Particle Tracing. When this option is turned on, the user will see what appears to be particles of water moving through the flow field. This is a visualization of water particle movement to improve the understanding of the velocity and the direction of the flow. To turn this option on, press the Particle Tracing button ![]() above the map window. Once this option is turned on, from the Velocity Map Parameters window (Figure 6-13) the user can change the parameters that control the particle tracing visualization. These parameters are: Speed (Speed the particles move. The speed is a relative speed, it is not the actual speed of the particles); Density (density of the particles); Width (how thick they appear); Lifetime (how long a particle trace will last); Speed Relative to Zoom (this automatically changes the speed with the zoom level); and Anti-Aliasing (Yes provides smoother lines for the particle traces, but takes more compute power. No produces particle lines that are not as smooth, but takes much less compute power) The user can toggle Particle Tracing on and off by using the F5 key (The plot window must be the active window when using the F5 Key to turn particle tracing on and off). Additionally the user can increase or decrease the speed of the particles (to improve the visualization), by using the + key to speed up the particles and the – key to slow down the particles. The user can also change the density of the particles. Holding down the Cntrl key and then pressing the + key will increase the density of the particles, while holding down the Cntrl key and then the – key will reduce the density of the particles.
above the map window. Once this option is turned on, from the Velocity Map Parameters window (Figure 6-13) the user can change the parameters that control the particle tracing visualization. These parameters are: Speed (Speed the particles move. The speed is a relative speed, it is not the actual speed of the particles); Density (density of the particles); Width (how thick they appear); Lifetime (how long a particle trace will last); Speed Relative to Zoom (this automatically changes the speed with the zoom level); and Anti-Aliasing (Yes provides smoother lines for the particle traces, but takes more compute power. No produces particle lines that are not as smooth, but takes much less compute power) The user can toggle Particle Tracing on and off by using the F5 key (The plot window must be the active window when using the F5 Key to turn particle tracing on and off). Additionally the user can increase or decrease the speed of the particles (to improve the visualization), by using the + key to speed up the particles and the – key to slow down the particles. The user can also change the density of the particles. Holding down the Cntrl key and then pressing the + key will increase the density of the particles, while holding down the Cntrl key and then the – key will reduce the density of the particles.
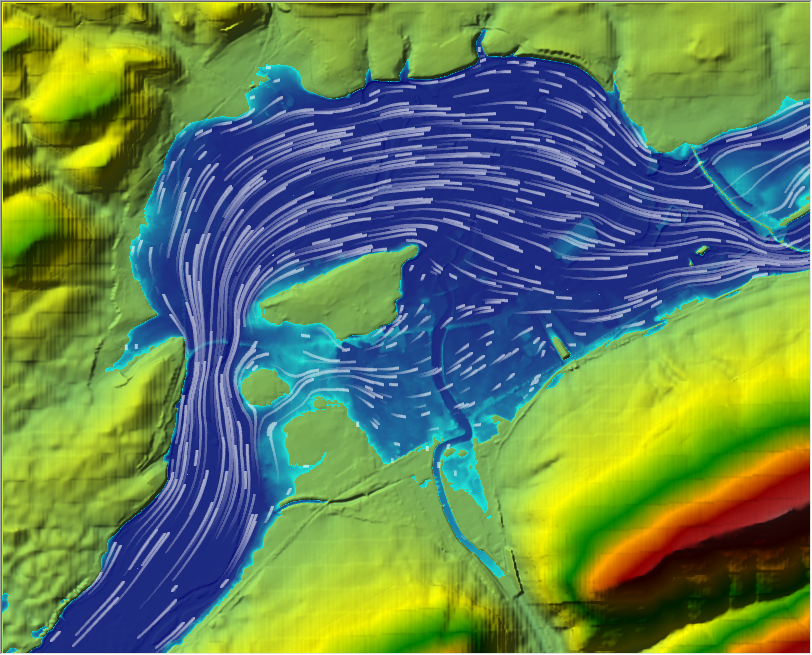
The particle tracing visualization option can be turned on over the top of the colored velocity plot, or over top of the depth and elevation plots. This option is extremely helpful in visualizing where water is going, and the relative magnitude of the velocity. Try it out; it's really fun and informative!!! Shown in Figure 6-15 is an example plot with the velocity particle tracking option turned on, and being displayed on top of a depth layer plot.