Download PDF
Download page Drop Structures.
Drop Structures
Drop structures can be modeled with the inline weir option or as a series of cross sections. If you are just interested in getting the water surface upstream and downstream of the drop structure, then the inline weir option would probably be the most appropriate (as described in a previous section of this chapter). However, if you want to compute a more detailed profile upstream of and through the drop, then you will need to model it as a series of cross sections.
When modeling a drop structure as a series of cross sections, the most important thing is to have enough cross sections at the correct locations. Cross sections need to be closely spaced where the water surface and velocity are changing rapidly (i.e. just upstream and downstream of the drop). An example of a drop structure is shown in the figure below.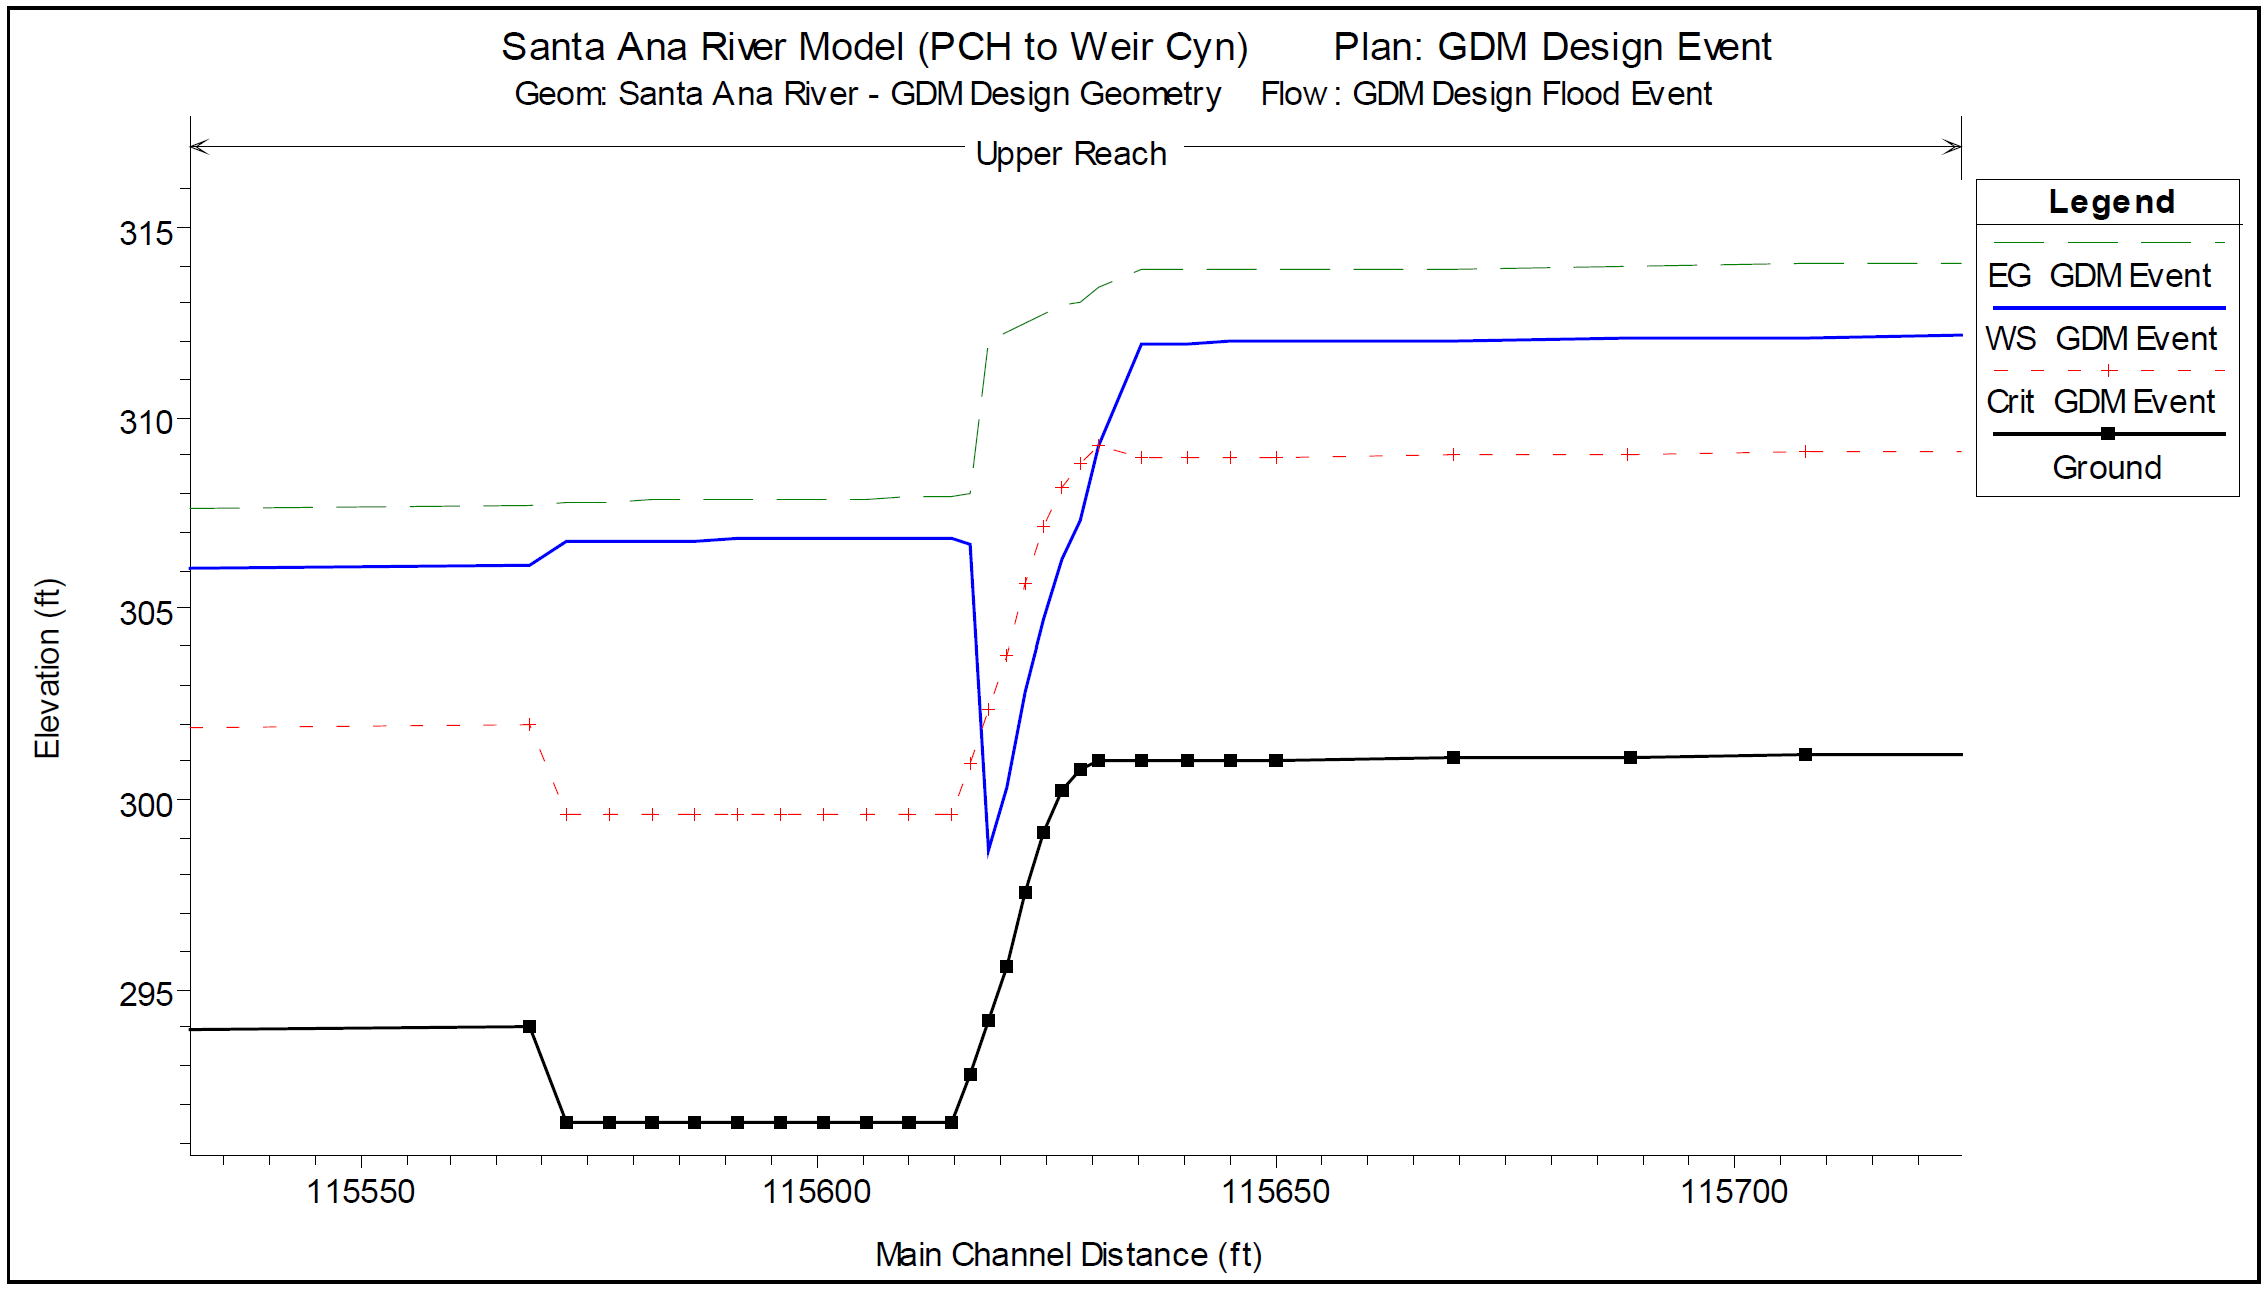
As shown in the figure above, the spacing between cross sections should decrease as you get closer to the drop structure (cross sections are located at each square shown on the ground profile). Additionally, if the drop itself is on a slope, then additional cross sections should be placed along the sloping drop in order to model the transition from subcritical to supercritical flow. Several cross sections should also be placed in the stilling basin (location of energy dissipaters) in order to correctly locate where the hydraulic jump will occur (i.e. the hydraulic jump could occur on the slope of the drop, or it may occur inside of the stilling basin). Manning's n values should be increased inside of the stilling basin to represent the increased roughness due to the energy dissipater blocks.
In order to evaluate this method of modeling drop structures, a comparison was made between a physical model study and an HEC-RAS model of the drop structure. During the design phase of improvements to the Santa Ana River, the Waterways Experiment Station (WES) was contracted to study the drop structures and make recommendations. The results of this study were reported in General Design for Replacement of or Modifications to the Lower Santa Ana River Drop Structures, Orange County, California (Technical Report HL-94-4, April 1994, USACE). Over 50 different designs were tested in 1:25 scale flume models and 1:40 scale full width models. The designs evaluated existing structures, modifying original structures and replacing them with entirely new designs. The drop structure design used in the Santa Ana River is similar to one referred to as Type 10 in the report. An HEC-RAS model was developed to model the Type 10 drop structure and the model results were compared to the flume results.
The geometry for the HEC-RAS model was developed from the following design diagram in the WES report (see figure below).
The total reach in the model was 350 feet, 150 upstream of the crest of the drop structure and 200 feet below the crest. The cross sections were rectangular, with the following spacing used in the HEC-RAS model:
| Location | Reach Lengths |
|---|---|
| Upstream of drop structure: | 10 feet |
| Over the drop: | 2 feet |
| Inside the stilling basin: | 10 feet |
| Downstream of structure: | 10 feet |
The expansion and contraction coefficients were set to 0.3 and 0.1 respectively. Two Manning's n values were used in the HEC-RAS model of the flume. Inside the stilling basin where the bottom elevation was 85 feet, the Manning's n values were set to 0.05. In all other cross sections the Manning's n values were set to 0.03. The higher n value was used in the stilling basin to account for the additional energy loss due to the rows of baffles that exist in the flume but were not added into the cross sections data of HEC-RAS.
The original data from the flume experiments were obtained from the Waterways Experiment Station and entered in HEC-RAS as observed data. The results of the HEC-RAS model are compared in profile to the observed water surface elevations from the flume study in the figure below. These results show that HEC-RAS was able to adequately model the drop structure, both upstream and downstream of the crest.
Some differences occur right at the crest and through the hydraulic jump. The differences at the crest are due to the fact that the energy equation will always show the flow passing through critical depth at the top of the crest. Whereas, in the field it has been shown that the flow passes through critical depth at a distance upstream of 3-4 times critical depth. However, as shown in the figure above, a short distance upstream of the crest the HEC-RAS program converges to the same depth as the observed data. HEC-RAS correctly obtained the maximum upstream water surface is the most important part of modeling the drop structure.
Downstream of the drop, the flow is supercritical and then goes through a hydraulic jump. The flume data shows the jump occurring over a distance of 50 to 60 feet with a lot of turbulence. The HEC-RAS model cannot predict how long of a distance it will take for the jump to occur, but it can predict where the jump will begin. The HEC-RAS model will always show the jump occurring between two adjacent cross sections. The HEC-RAS model shows the higher water surface inside of the stilling basin and then going down below the stilling basin. The model shows all of this as a fairly smooth transition, whereas it is actually a turbulent transition with the water surface bouncing up and down. In general, the results from the HEC-RAS model are very good at predicting the stages upstream, inside, and downstream of the drop structure.