Download PDF
Download page Bias Correction.
Bias Correction
Sediment transport is non-linear. Therefore, a flow-load or flow-concentration rating curve is almost always non-linear.
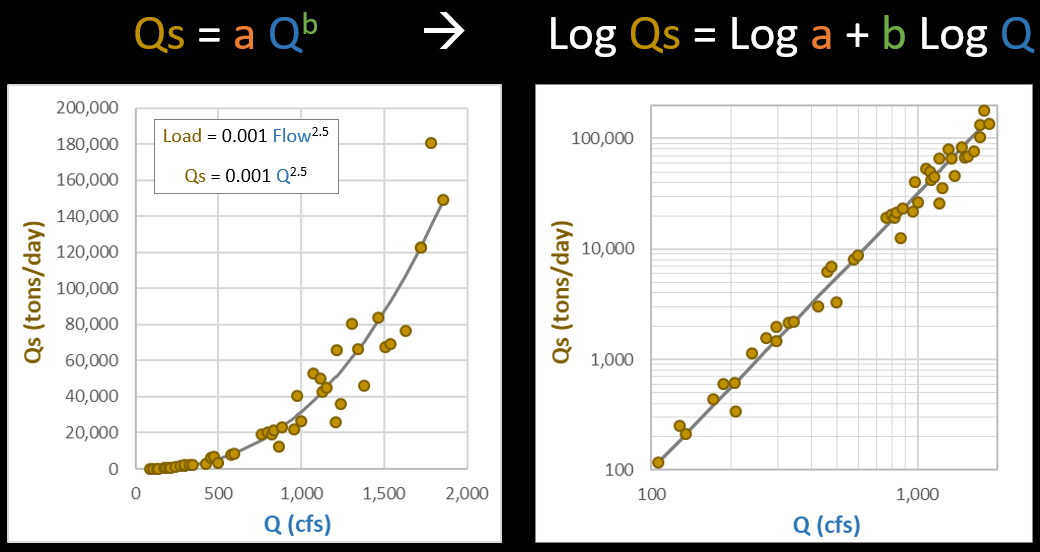
We usually represent a flow-sediment relationship with a power function, such that:
Qs=aQb
Where Qs is the sediment load, Q is the flow, a is a small coefficient, and b is a power (usually between 1.5 and 2.5).
But the most common method to fit a power function to data like these includes an intrinsic bias. The log-transform, Least Mean Square Error, that a program like Excel uses to fit a power function includes an implicit bias, making the rating curve it produces systematically low.
It is important to correct for this bias when you create a power function rating curve through sediment data.
The Rating Curve Analysis Tool applies a bias correction by default. But it also has two options for this bias correction and it is useful to understand what the software is doing.
This section describes these bias corrections.
Where Does The Bias Come From?
Before describing the bias correction, it is helpful to understand where the bias comes from.
The Least Mean Square Error (LMSE) approach to linear regression measures the residuals between the regression and each observation and computes the line (slope and intercept) that minimizes those errors.
Fitting a power function to log-distributed data usually uses a log-transform approach. The figure below includes a synthetic power function and data sampled from it with random residuals. The power function is non-linear in arithmetic space. But in log-log space the power function becomes linear. This is because a log-transform of the power function takes a linear form (see below). So, by log-transforming the data, the form of y = b + mx and we can apply the tools of simple linear regression to the log residuals.
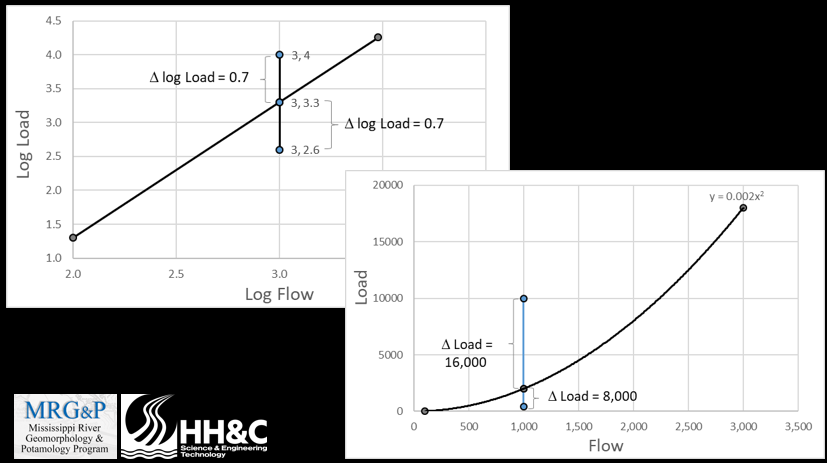
Log-transforming the regression makes it relatively easy to fit a power function to log-distributed data. However, it also introduces a bias when the data are untransformed. For example, the observations in the figure below have equal and opposite residuals in the logarithmic transformation (0.7). However, when these residuals untransform, the positive residual is larger than the negative residual. Therefore, the log-transformed linear regression ends up with larger positive residuals than negative, making the fit power function systematically low. This rating curve will under-predict sediment load for a given flow.
Bias Correction Functions
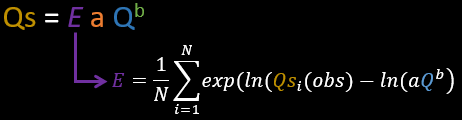
There are several bias correction functions (sometimes called "predictor correctors"). The Duan Smearing Estimate is widely used, but USACE practitioners have also used Ferguson. The Sediment Rating Curve Analysis Tool uses Duan by default, but also reports Furguson, and allows users to toggle between them. These methods all tend to quantify the variability of the residuals and backs out the asymmetry in the residuals to come up with a linear correction coefficient. For example, the Duan Smearing Estimate (E) is a linear coefficient in front of the power function, such that:
On the whole, the more spread the sediment data have, the higher the bias correction.
Bias Correction Results
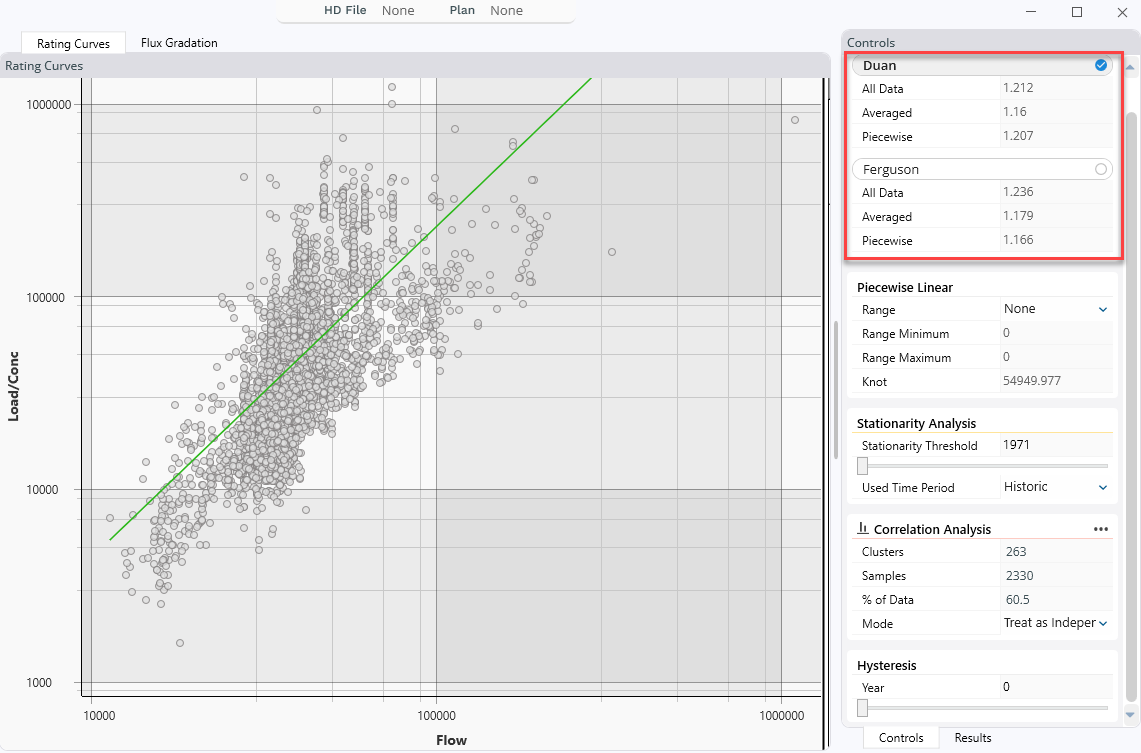
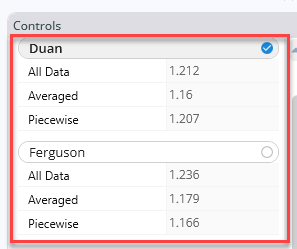
The Rating Curve Analysis tool automatically reports the Duan and Ferguson bias corrections, including factors for all of the data, the results after same-day (or a user-specified temporal grouping) data are averaged, and then the bias correction associated with the piecewise-linear model if one is (or was) selected. In the example below, the averaged data have a Duan Factor of E=1.16 which means that the rating curve increases the load 16% to account for the regression bias. The rating curve (green line in figure below) automatically inclueds the selected bias-correction. Users can select which bias correction to plot by toggling between Duan and Ferguson.
These correction factors also show up in the tabular data.
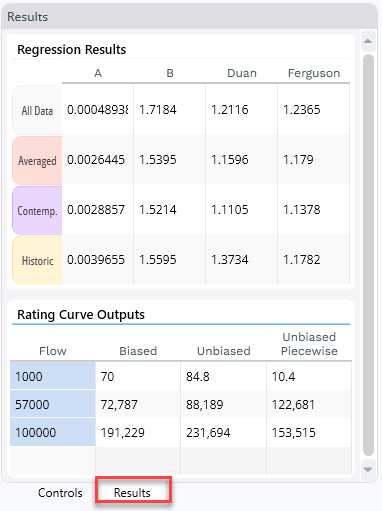
The coefficients are reported (with the a and b coefficients for the power function) in the Regression Results, and included in any rating curve output described as Unbiased (based on the approach selected in the Bias Correction control window).
References
Duan, N. (1983). “Smearing estimate: A nonparametric retransformation method.” Journal of the American Statistical Association, 78(383), 605–610.