The Sediment Rating Curve Analysis Tool downloads sediment loads, concentrations, and gradations directly from the USGS (or uploads them from a tab delimted file or Excel) and applies a range of statistical analyses and visualizations to help modelers and scientists understand their data and develop rating curves or trends to include in sediment budgets or models.
This video is a brief demo of the capabilities in the 6.2 release version.
This video provides an overview of the methods in an alpha version of this new tool. The release version has much more functionality, especially direct download capabilities for USGS sediment data and a different layout/look/feel (see above video)- but this one goes into more depth on the statistics and methods.
Sediment data are noisy. They tend to include a lot of uncertainty, measurement error, and natural variability. But sediment models require modelers to summarize these data into more concrete inputs and trends that the model can use. The two most common data analysis tasks users encounter include summarizing the flow-load data with a sediment rating curve and evaluate sediment load gradation trends.
The Sediment Transport User Guide includes an extensive discussion of common data challenges encountered in the process of developing a sediment rating curve and analyses that modelers should do with their data before settling on a sediment relationship for their boundary conditions. These are also summarized in this video:
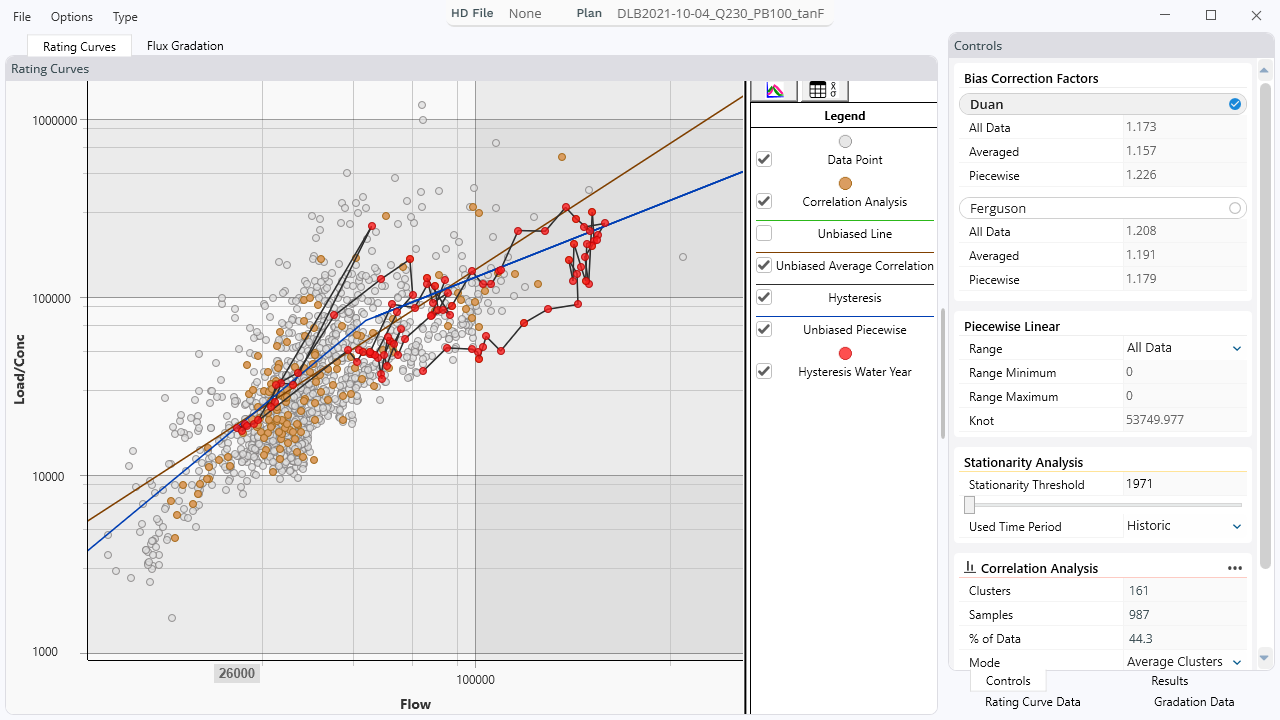
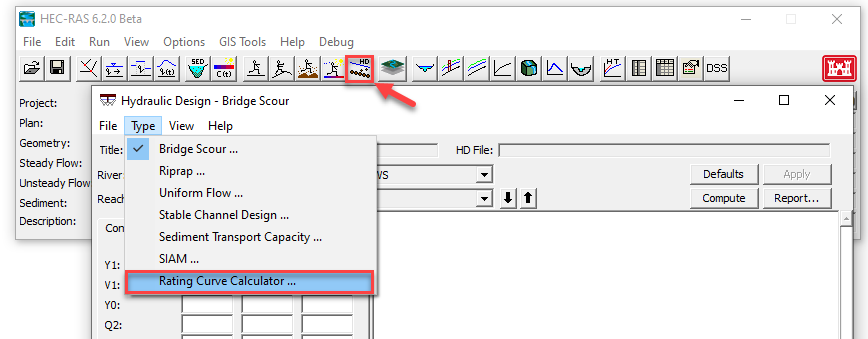
But the latest version of HEC-RAS includes a Sediment Rating Curve Analysis Tool that standardizes these analyses and provides simple tools to help sediment modelers and analysts think carefully about their data and develop quality relationships for model boundaries or sediment budgets. The tool includes the following capabilities:
|
|
|
|---|
| Import Sediment Data | | The Rating Curve Analysis Tool can import data directly from the USGS website (for US users) or from standard csv formats. |
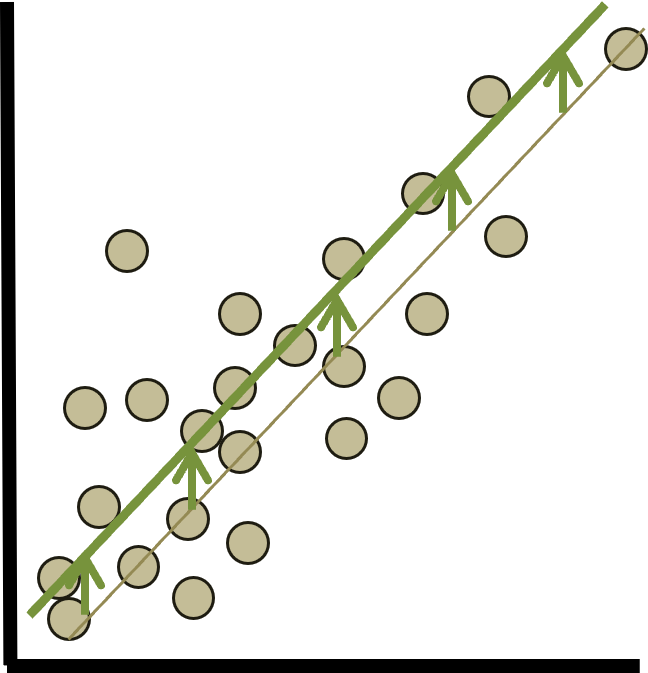
| Bias Correction | | The tool provides two methods to rectify bias implicit to the log-transform regression used to develop sediment rating curves |
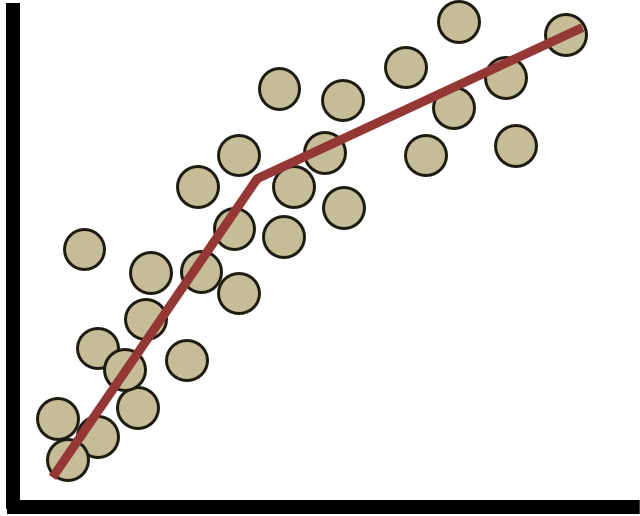
| Piecewise Linear | | The tool includes new methods to fit "bent" rating curves to sediment data (e.g. for supply limited scenarios) |
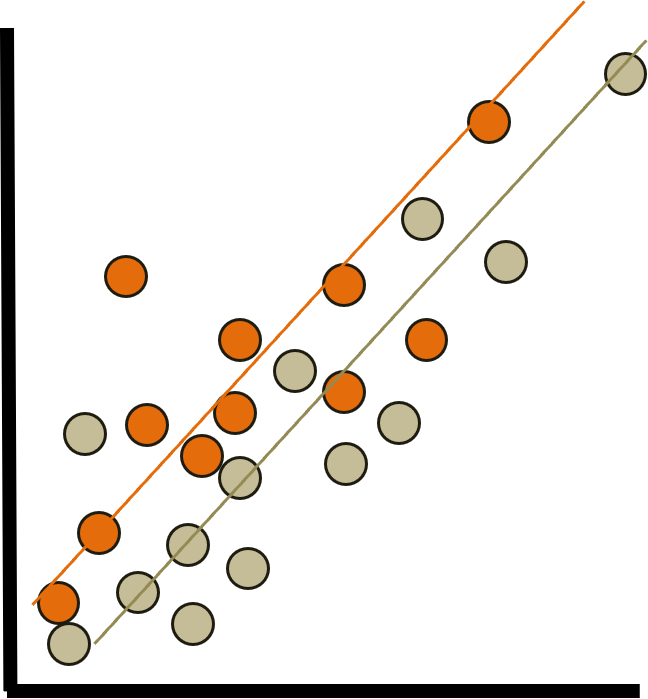
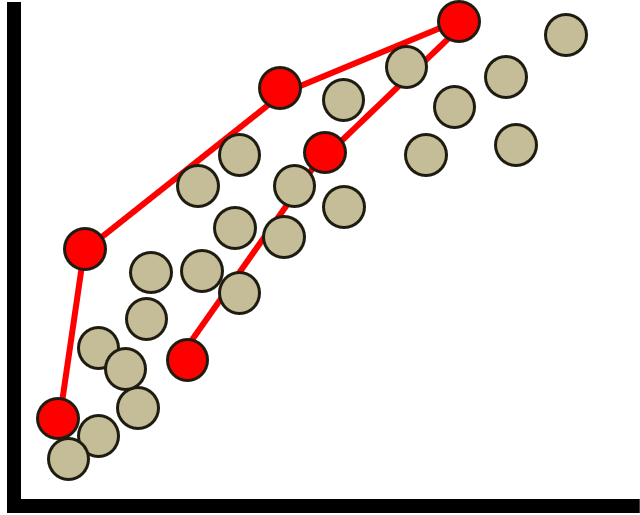
| Stationarity | | These are visualization methods to explore how sediment data change over time and fit rating curves to temporal sub-sets of the observations |
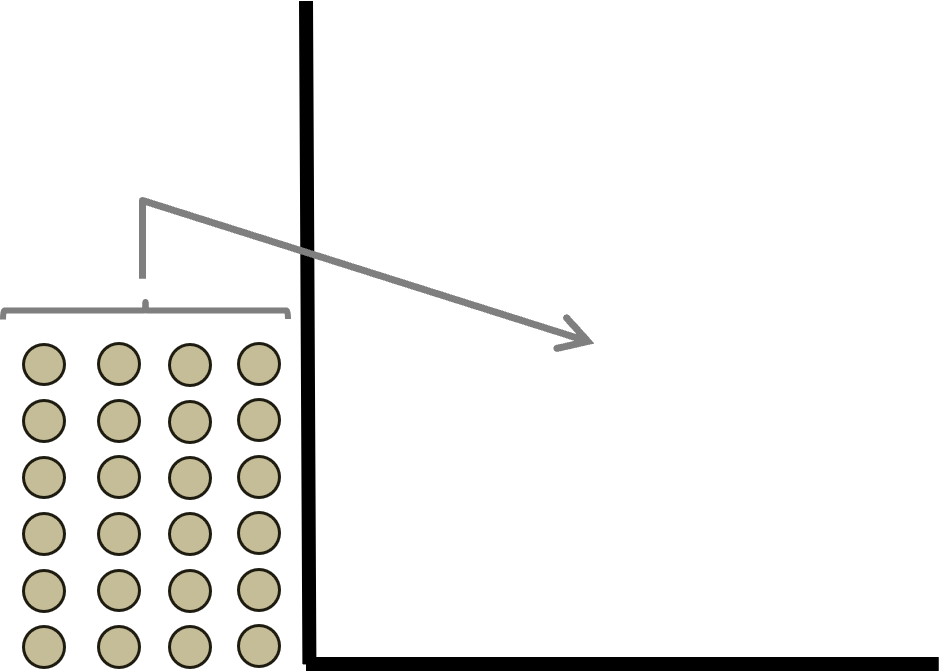
Temporal Averaging and Autocorrelation
| | Groups observations collected within a specified time window to avoid over-representing them and violating the independence assumption. |
| Hysteresis | | Traces the temporal path of flow-load/concentration data over a water year |
| Rating Curve Results |
| These tools allow users to build their rating curve power function or populate their flow-load table for HEC-RAS. |
| Load-Gradation Trends | | These tools help users visualize the load-gradation data and determine if there is a fining or coarsening trend with flow. |
The Rating Curve Analysis Calculator development was funded by the Mississippi River Geomorphology and Potomology Program (MRG&P). Additional features and documentation were funded by the Hydrology, Hydraulics and Coastal Community of Practice, Science and Engineering Technology program (HH&C- SET).