Multiple grain class sediment models not only require flow-load or flow-concentration rating curves, they also require users to partition those loads by grain class. Sediment transport is very sensitive to the size distribution of the transporting sediment. HEC-RAS requires not-only a flow-load/concentration relationship but also requires users to specify the fraction of each grain class associated with each load.
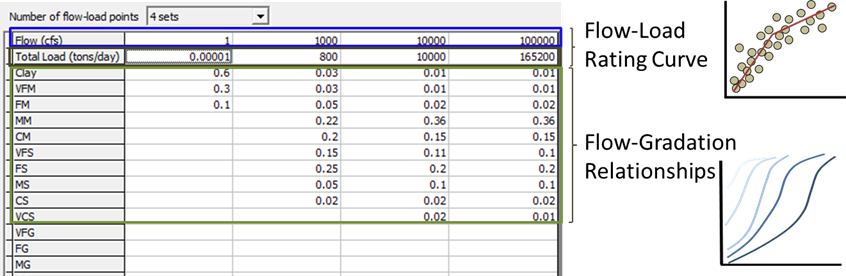
Estimating the grain-class partition of each load is often the most difficult boundary condition to estimate in a sediment model. The data are often scarce, and when the exist, they are usually noisy. HEC added a gradation analysis tool to the Sediment Rating Curve Calculator to help modelers and scientists to visualize and quantify these trends.
Suspended Load Gradation Trends
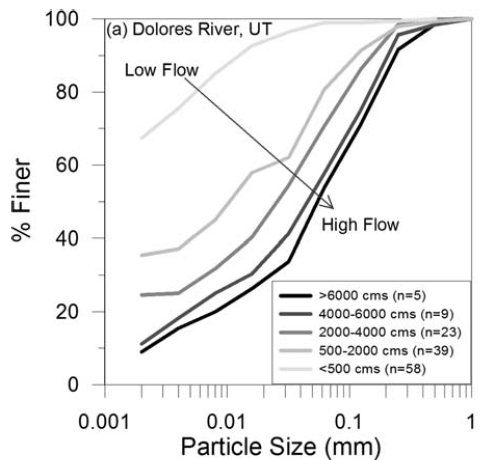
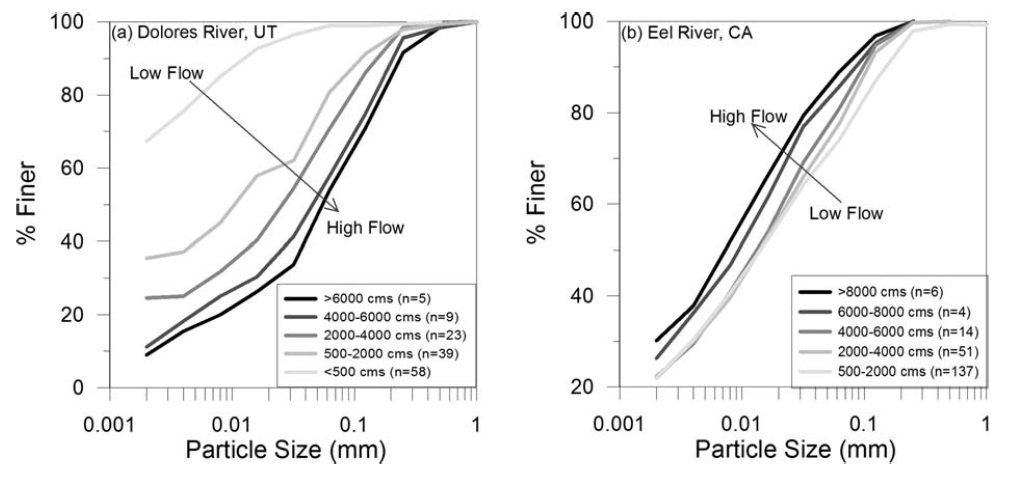
Suspended load can fine or coarsen with flow, or remain approximately the same. This process diversity complicates gradational trend analysis. The figure below includes data from a gage that coarsens with higher flows and another that fines. Gibson and Cai (2017) describes these trends and provides some context for these trends.
Load Gradations Must Include Bedload
Most of the sediment load and gradation data downloaded from the USGS are suspended load measurements. But river morphology is disproportionately sensitive to the bed load gradations. Therefore, even thought bed load might be a small percentage of the load, augmenting the suspended load gradations with bed load grain classes is often essential to get a sediment model to reproduce prototype behavior. Some gages have bedload data and future versions of this tool may import and integrate those measurements. But bed load data are rare and bed load gradations are more rare. Modelers must use scientific intuition to add bed load gradations based on the bed material and often adjust these fractions during calibration.
Viewing Suspended Load Gradations
If a gage has gradation data associated with flows, the Sediment Rating Curve analysis tool will automatically import them. The importer groups gradation data assigned to the same sample, builds a geotechnical (% finer) curve and computes gradation statistics for each sample.
To view the gradations, select the Flux Gradation tab on the main plot of the tool. This provides two different visualizations of the gradation data.
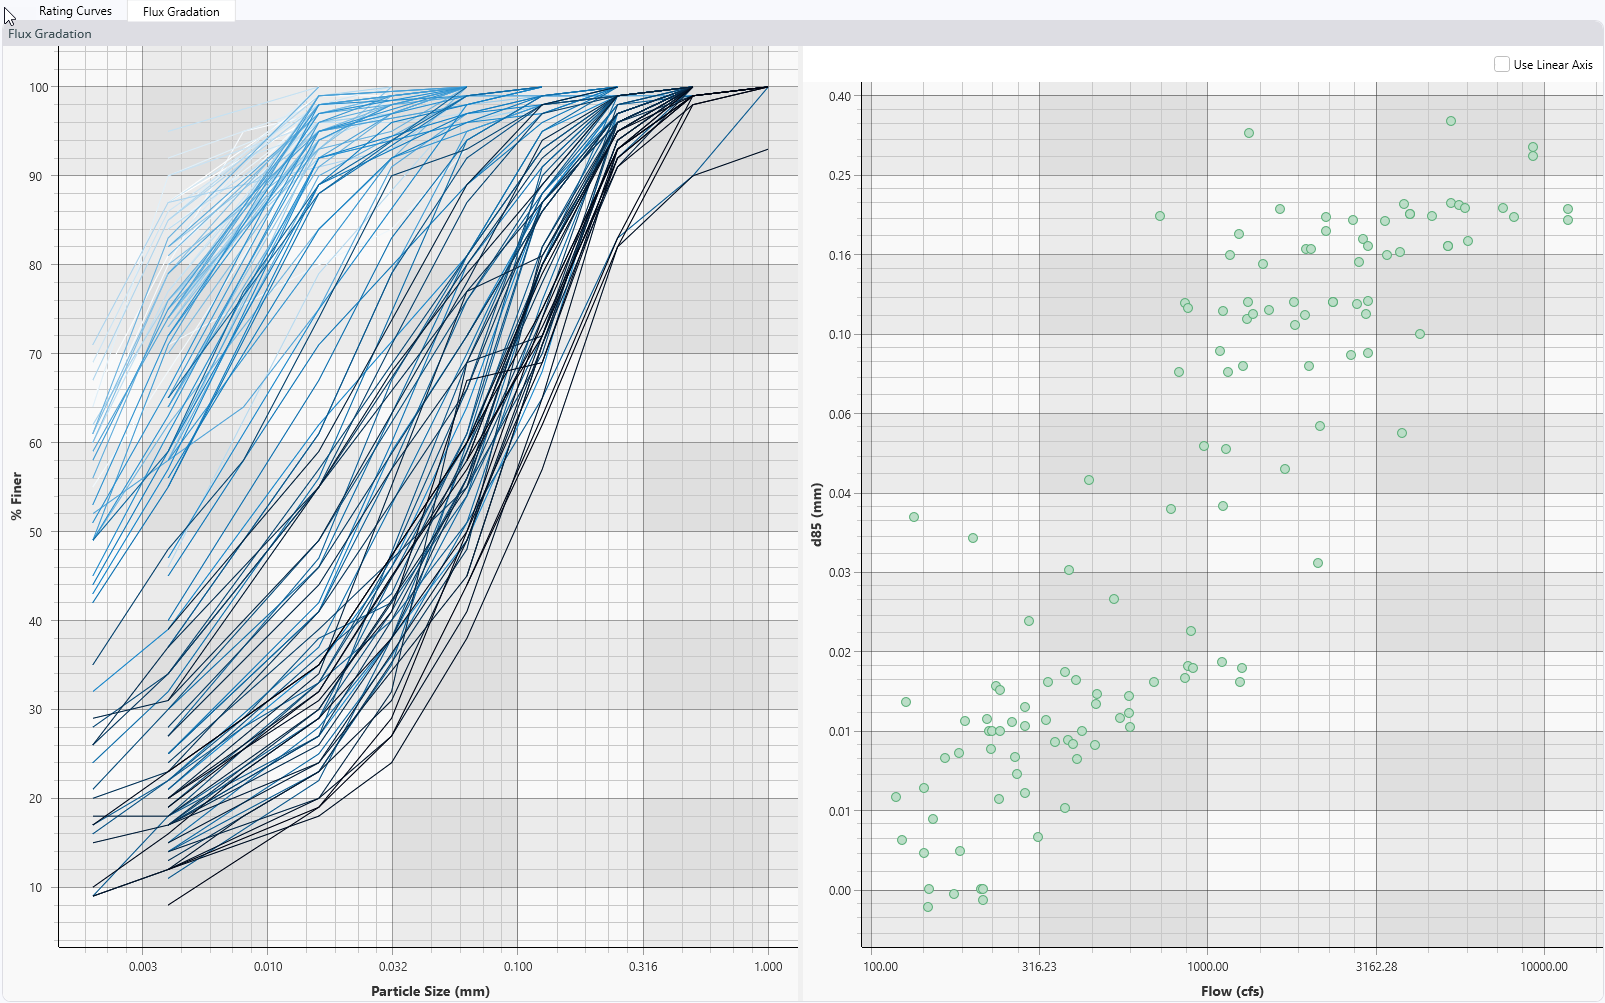
The plot on the left is a monochromatic plot of the gradation curves. The monochromatic color scheme plots by flow, so gradations associated with lower flows are light blue and those associated with higher flows are darker. For the gage pictured above, the lighter colors plot to the upper left, and the darker lines plot to the left, which means the higher flows are coarser.
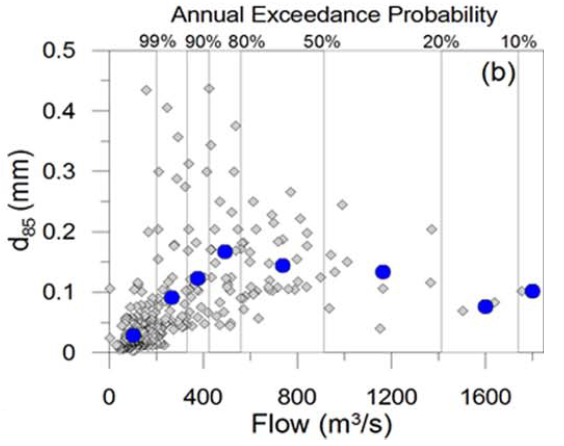
The visualization on the right plots summary statistics against flow. The gage pictured above depicts the d85 tending up with flow, also indicating flow-coarsening.
Wish List: Binning, Bed Load, and Statistics
There are several statistical and visualization strategies that can help users understand the trends in these data, which can be very noisy, and are not always monotonic. We would like to add binning, regression, and other visualization and summary tools, including several included in Gibson and Cai (2017). We would also like to import bed load data and gradations where available and find intuitive ways to plot those with the suspended data and integrate them into the summary results.