A process that is path dependent, that takes a different path on the way up than it does on the way down, has hysteresis.
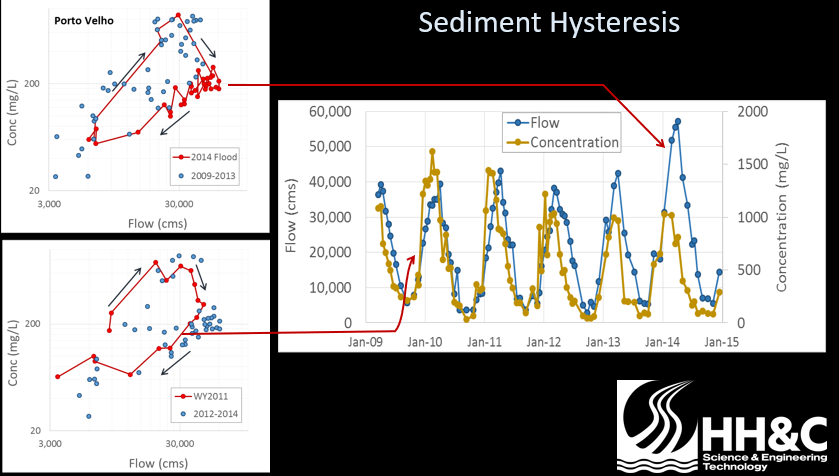
Sediment load data often has hysteresis. Loads are often higher on the rising limb of the hydrograph than they are on the falling limb of the hydrograph.
The data below include the flow hydrograph and sediment time series measured at the Porto Velho gage on the Madeira River (right). The plots on the left show the sediment measurements from water years 2011 and 2014 connected in time. This system has strong clockwise hysteresis (sediment loads are much higher on the rising limb of the hydrograph than the falling limb).
Sediment modelers and scientists often lose track of hysteresis effects when we simply plot flow vs load or concentration as temporally naïve paired data.
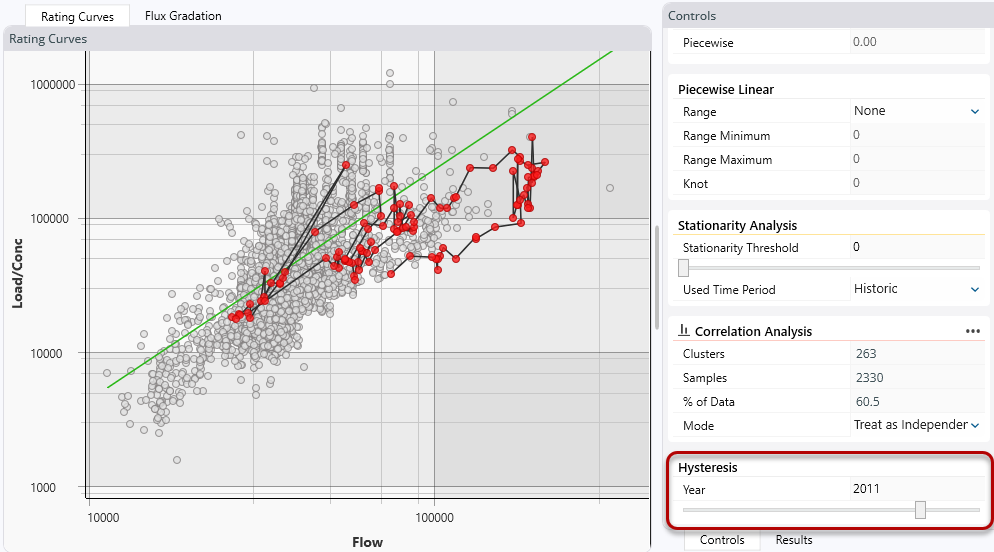
Because a rating curve does not distinguish between the rising and falling limb of a hydrograph, but make a 1-to-1 relationship between flow and load, the hysteresis tools in this software do not affect the rating curve or calculations. However, it can be very useful to visualize hysteresis. In some cases, this may motivate modelers to use a sediment time series for a model boundary condition instead of a rating curve).
The Rating Curve Analysis Tool connects sediment measurements collected in the same water year. Type in a water year or move the scroll bar to track the temporal path of the observations in that year. The gage below is plotting the hysteresis associated with a 2011 event, which delivered much more sediment on the rising limb than the falling limb.