Download page Plotting One Variable versus Another.
Plotting One Variable versus Another
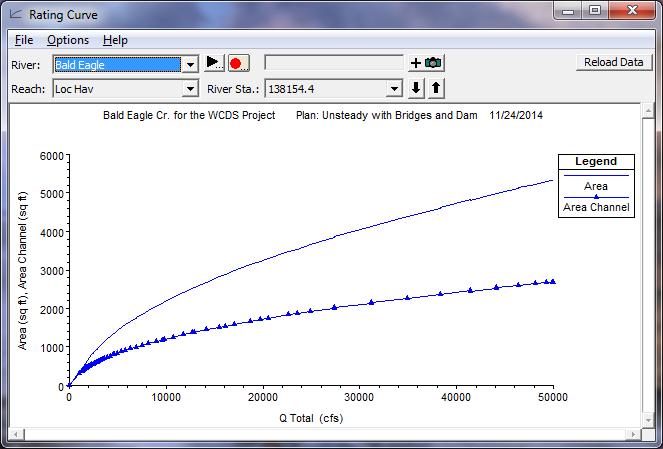
The rating curve plotting window has the ability to plot other variables besides discharge versus water surface elevation. Any variable that is computed at a cross section can be displayed against another computed variable (or variables). An example of this capability is shown in Figure 8-8. In this example, Discharge (x-axis) is being plotted against total flow area and main channel flow area (y-axis).
To plot other variables, the user selects the X Axis Variable and Y Axis Variables from the Options menu of the rating curve plotting window. When selected variables to plot, keep in mind that all variables selected for a particular axis should have a similar range in magnitude. Figure 88 Example of Plotting One Variable Against Other Variables