LOESS Local Regression Overview
LOESS is a non-parametric, localized regression model that develops a rating curve over smaller ranges of flows than the standard regression or piecewise linear. This can generate a more detailed flow-load or flow-concentration relationship that you can use to develop a rating curve with multiple inflection points or to evaluate the inflection point of a piecewise linear or polynomial (in future versions) rating curve. LOESS does not extrapolate beyond the data, so it does not replace the other models. But i

LOESS fit with a 0.5 span of Big Blue River at Randolph, KS (USGS Gage 06886000)
This video presents an accessible introduction to the basic ideas behind this approach (including a discussion of the "span") in HEC-RAS:
(This video is even simpler and shorter, if a little quirky).
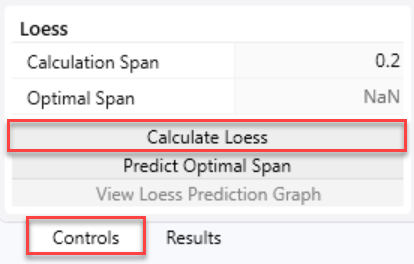
Calculate LOESS
Press the Calculate LOESS button to compute and plot the local regression curve with whichever span is selected (see section on selecting a span below)
Selecting a Span
A span of 0.1 includes 10% of the data in each local regression, weighing the observations closer to the evaluation flow more than those farther away. The span of 0.5 includes half the observations in each local regression, and the span of 1.0 includes all of the points in each calculation, but weights the observations closer to the evaluation flow more than those farther away, so the local regression for each flow is still variable, but the curve is smoother.
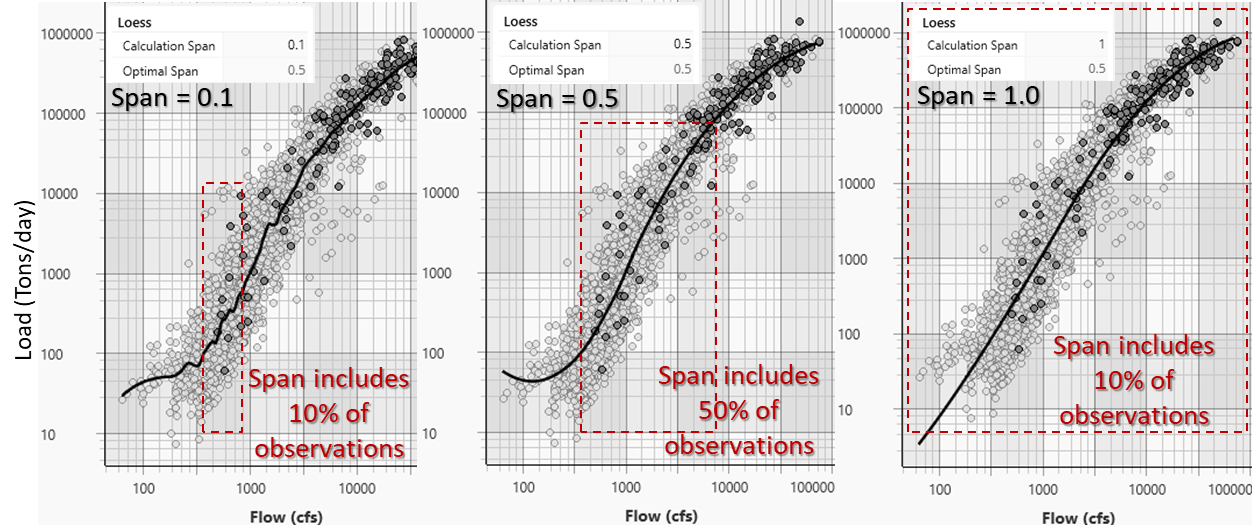
Smaller spans put more weight on local trends and perturbations, and run the risk of over-fitting (following random perturbations in the data too closely and incorporating noise into the model). Large spans smooth the data but could miss detailed trends. For sediment work, it usually makes sense to select a larger span and avoid the noise of overfitting. In the case pictured above, the span (0.5) closest to the recommended value (0.45 - see the next section) is probably the best model for these data).
Computing a Span
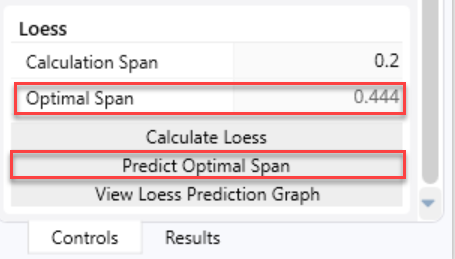
A larger span smooths the curve because it considers more of the data at each point of the local regression. HEC-RAS includes two methods (GCV and AICC) to compute an appropriate span that balances the tradeoffs between over-fitting (span too small) and over-smoothing (too large). Press the Predict Optimal Span button to run these algorithms. (Note: These are relatively computationally expensive and can take up to a minute). HEC-RAS will report the span that minimizes GCV and AICC in the Optimal Span field. Users can then use that number (or experiment with numbers in that vicinity) in the Calculation Span field and re-Calculate LOESS.
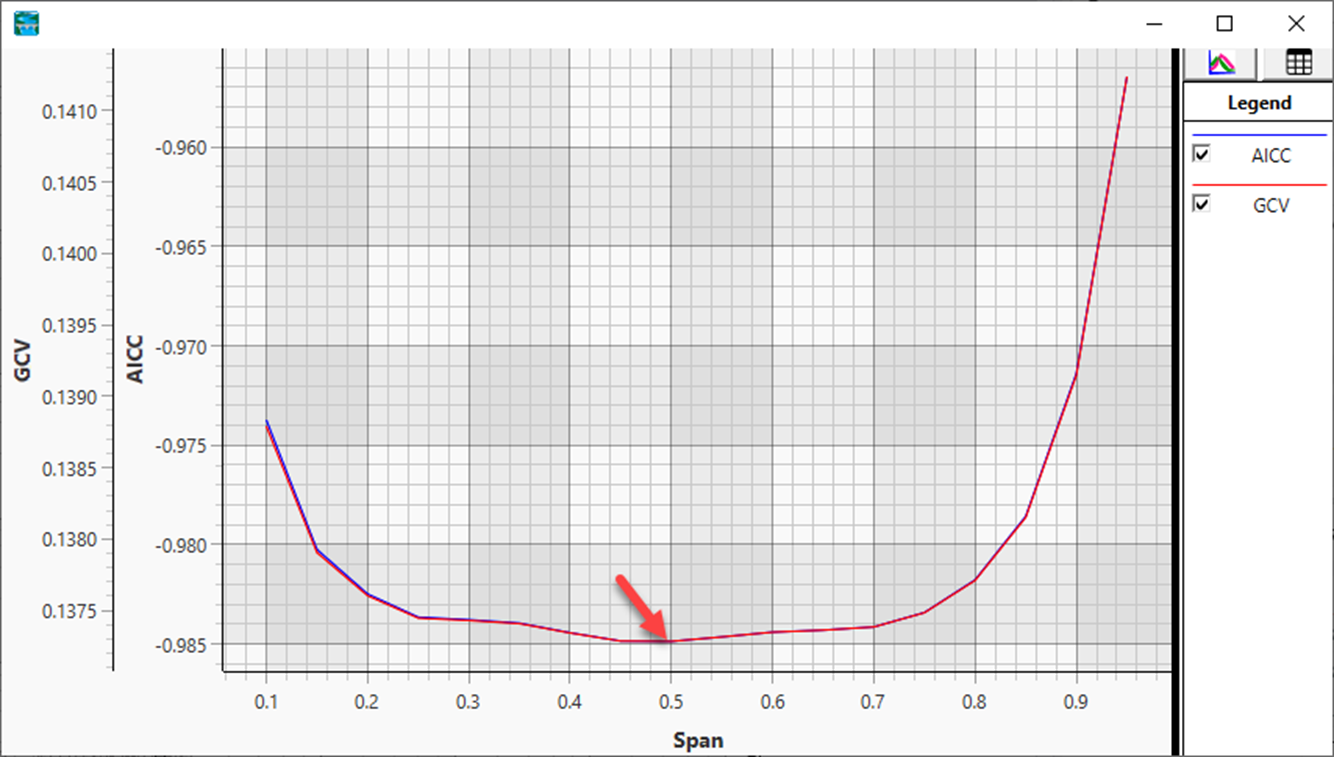
To evaluate the span metrics users can select View LOESS Prediction Graph which plots the GCV and AICC metrics for the whole range of spans. In the example below, the 0.5 is the minimum of both metrics, but the results from 0.4 to 0.7 are relatively consistent, so anything in this range would be appropriate.
Harvesting a Rating Curve
One of the liabilities of LOESS is that it does not generate a "closed form solution" (i.e. an equation like Qs=aQ^b). Therefore you will need to pick flow-load pairs off the chart (the most recent version of 6.4 does not
References
This method was developed with help from Dr. Andrew Blandino who provided this technical documentation of the method.
Cleveland, W.S. (1979) "Robust Locally Weighted Regression and Smoothing Scatterplots," Journal of the American Statistical Association, Vol. 74, pp. 829-836.