Download PDF
Download page Importing Sediment Data.
Importing Sediment Data
The Rating Curve Analysis Tool includes several methods to import and input data. Most of these methods follow US Geological Survey data formats because most US users will get sediment data directly from the USGS data portals (and most will use the automatic download tools described below).
HEC-RAS requires paired flow-load/concentration data to use the sediment rating curve tool. It can only display load or concentration, but it can import either (or both formats) and convert between them. It is also helpful to include dates and times for these flow-load/concertation pairs. USGS data should include these dates and times automatically. If you are entering flow-load/concertation data manually or creating an import file in one of the supported formats, and do not have dates and times, you can still import dateless flow-load/concentration and gradation information. But several analyses with temporal components (e.g. stationarity, autocorrelation, and hysteresis) will not work without dates and times.
In the United States, the most common approach to retrieve sediment data will be to request it directly from the USGS website. The next section describes that process in detail. Go to the section on other file formats for information on formatting and importing other data or to the clipboard section for information on how to copy and paste data directly from Excel.
Downloading Data From USGS
Most practitioners in the United States get their data directly from USGS data portals. Historically, sediment scientists and modelers have downloaded data-dense text-based files to retrieve these data and post processed them in spreadsheets. More recently , the USGS has provided access through R packages. The Rating Curve Analysis Tool bypasses these processes and imports sediment load, concentration, and load-gradation data directly into HEC-RAS.
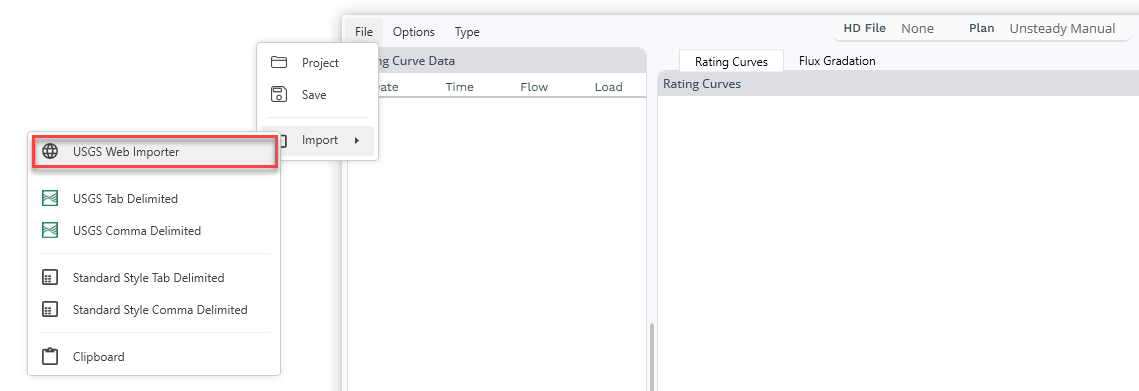
To download data, go to File→Import→USGS Web Importer.
The automatic web import tool requires two search parameters to narrow the list of gages to provide: the state and a text string (see red box below). The text string will recognize the gage number if you know the exact gage you are looking for, but if you input the river name it can also populate summary statistics for all the gages on the river to help decide which gages to work with. If the search returns a long list of gages, the importer can take a few seconds to populate the statistics for all the gages.
o find the gages with the most data, sort by any of the headings. In the following figure, ordered the Missouri River data from Nebraska by the number of sediment load or concentration measurements. But users can also sort by the total number of samples, the number of different water quality constituents measured, or the load-gradation samples available.
The new USGS Api does not support text search
In early 2025 the USGS switched to a new data format and server which does not support the text search depicted below. You will have to find the gage number first and enter the gage number in the search field to use the tool for now.

Selecting a gage will provide more information about the gage, including searchable meta-data and information on each available constituent (using the USGS codes). HEC-RAS can only import sediment data for now, but provides information on the other data available.
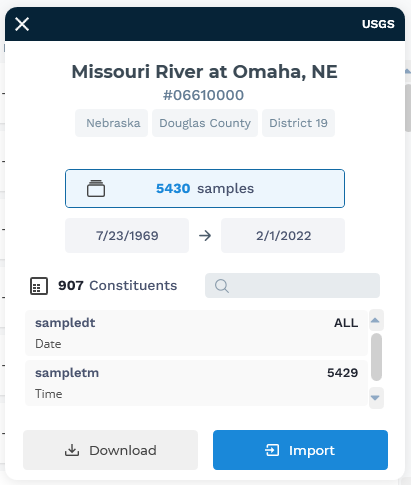
Press the Import button to download the sediment data into the Rating Curve Analysis Tool.
Some water quality measurements are stored with paired flow data but many of them are not. All of the capabilities of the Rating Curve Analysis Tool use paired sediment-flow data, so the tool will only import sediment data if it has paired flow data. If the water quality record has a measured flow (daily or instantaneous) associated with it, the Rating Curve Calculator will import both. But if the gage has sediment measurements without flows, the tool will show the option below. The top button just imports the sediment measurements paired with flows in the water quality data. But the bottom button reports how many sediment measurements do not have paired flows, and offers to reach out to the gage flow data and select the closest flow from the gage to pair with the sediment observation. This second option is recomended.
Before the data download, HEC-RAS will launch another download tool to guide users through some common decisions about which data they want and how the model should handle it:
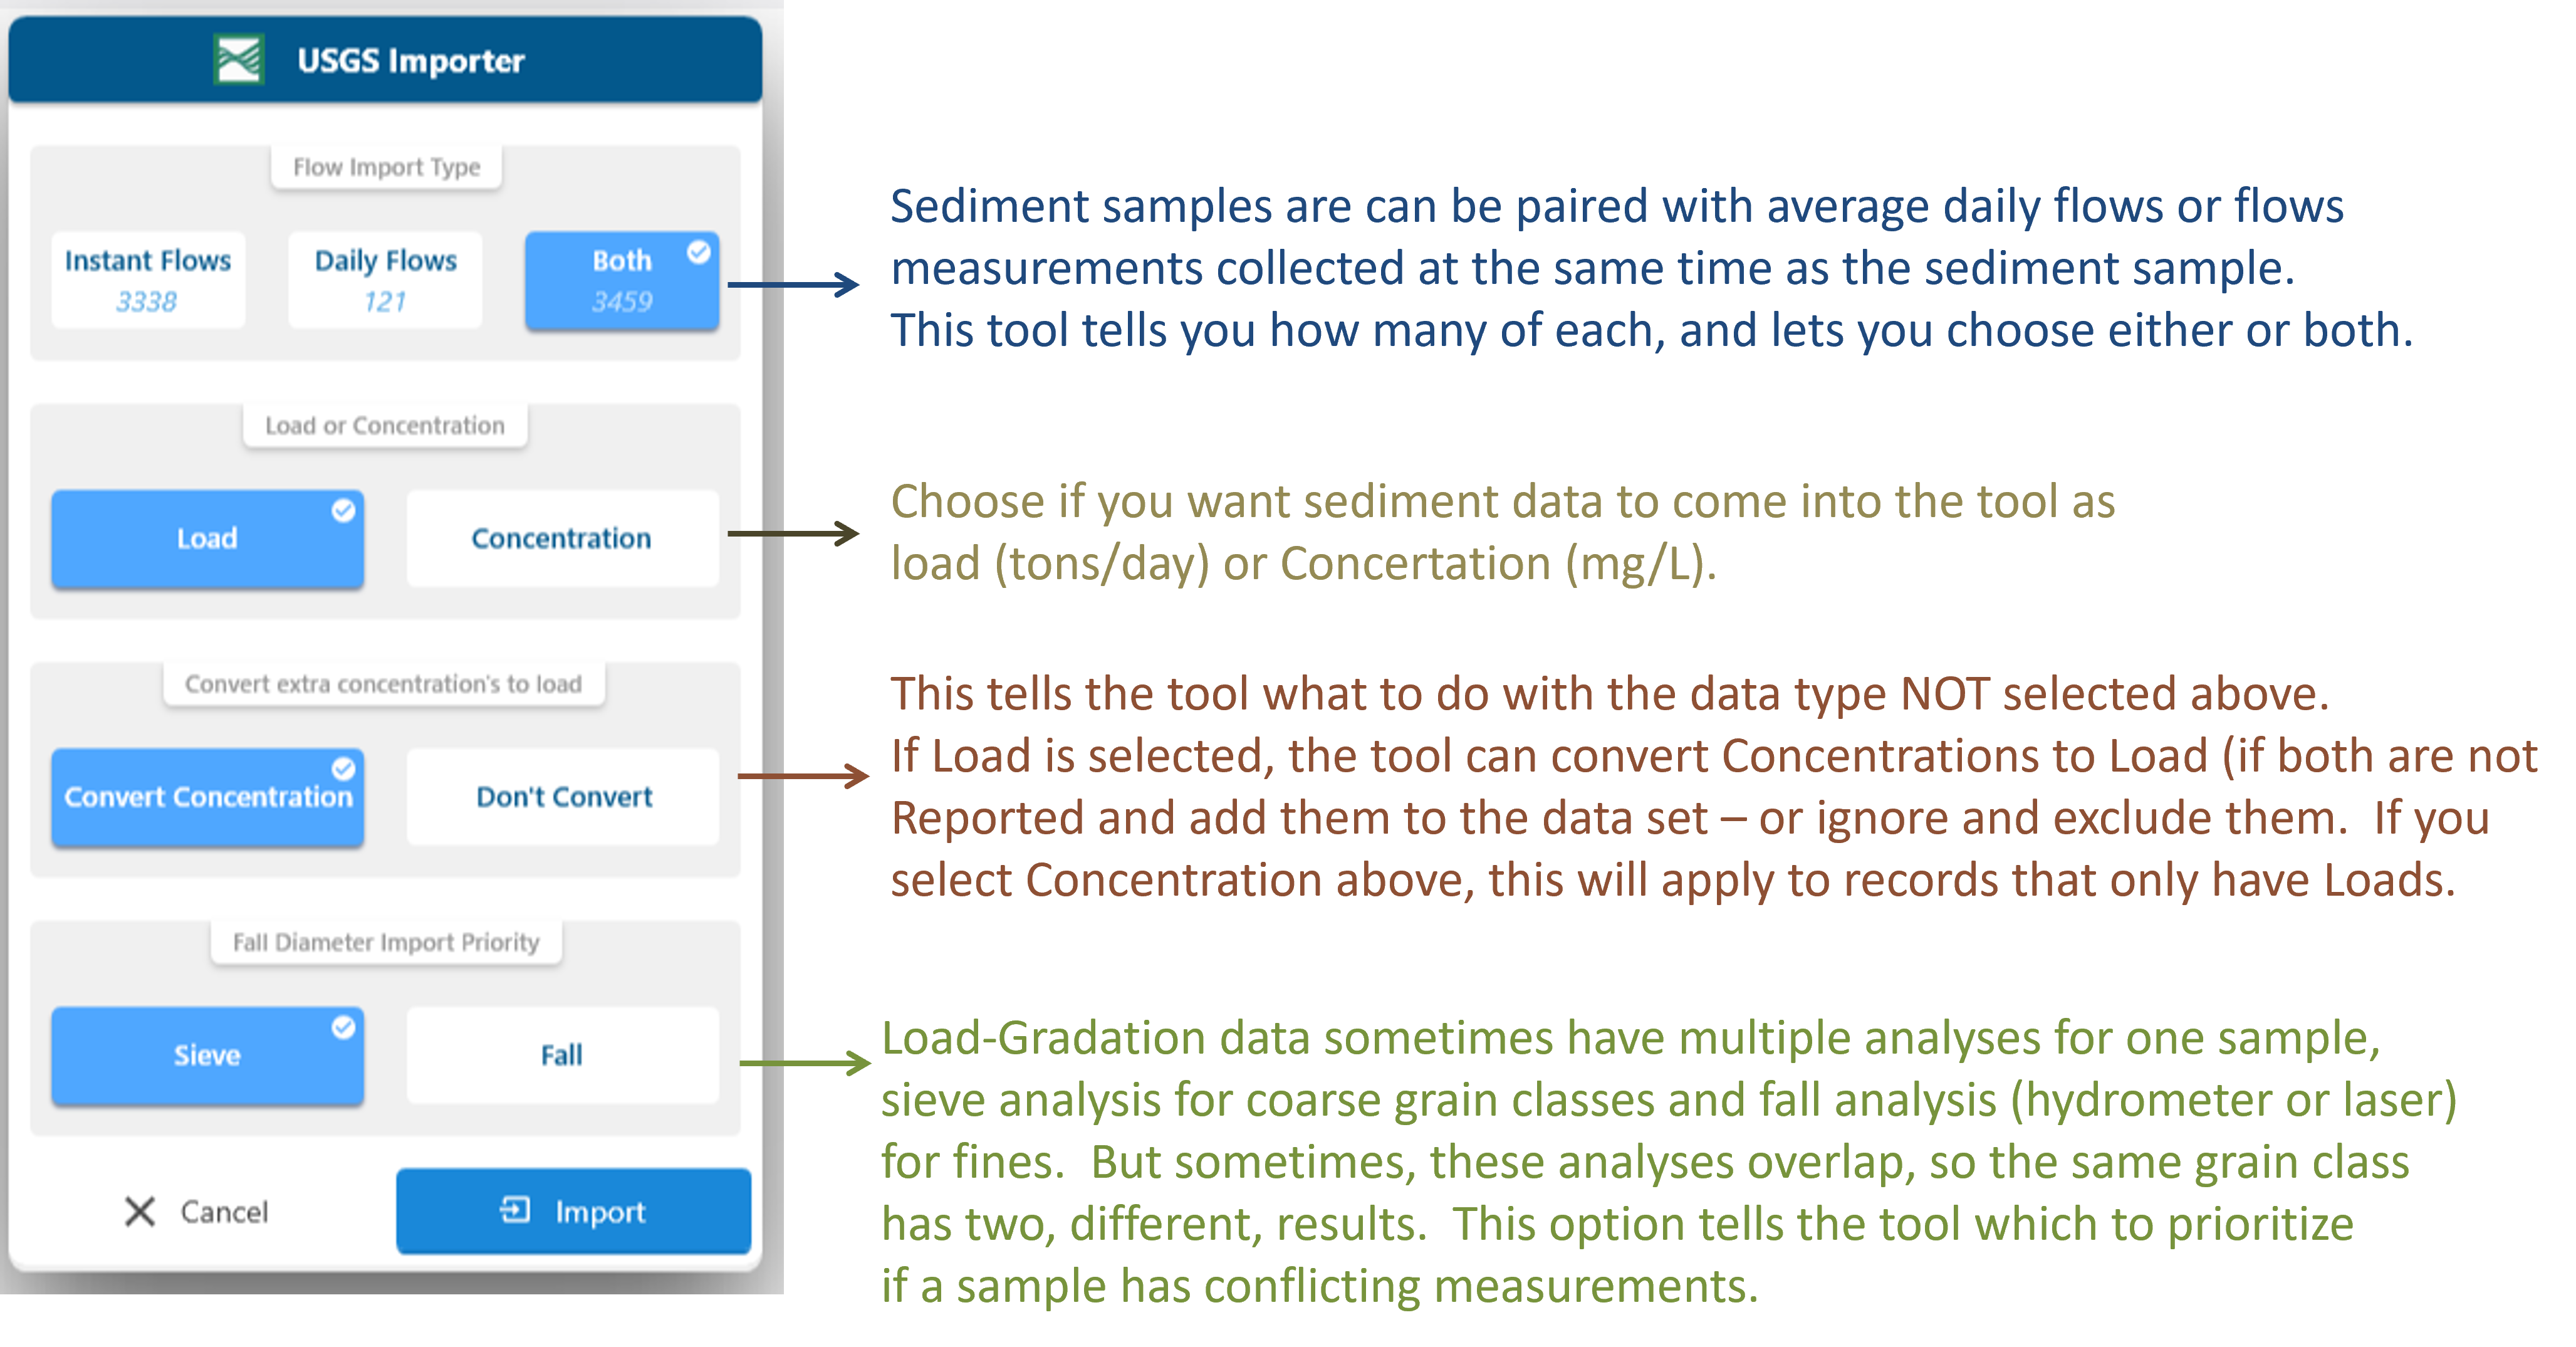
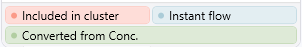
Even if you decide to import and/or convert all data , regardless of native type (instantaneous/daily, load/concertation) HEC-RAS color codes the imported data in the data grid to classify them by their native format.
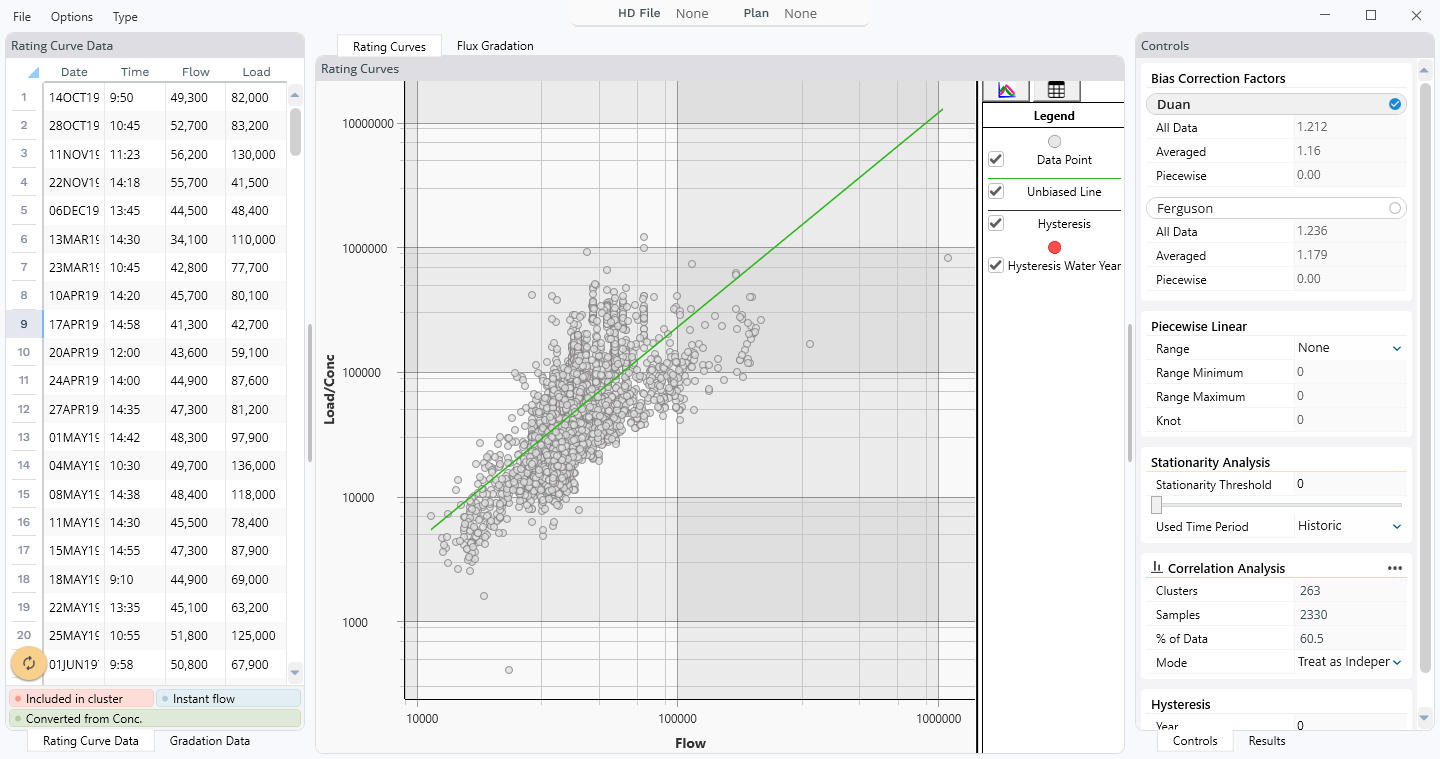
This will bring the data into the Sediment Rating Curve Analysis tool. The tool will plot the flow-load/concentration data in the main Rating Curve plot and populate the tabular data in the table on the left. However, it will also import the load-gradation data and plot them in the secondary tabs. By default, the tool will calculate a bias-corrected rating curve through the data with the Duan bias-corrector.

Converting Between Flow and Concertation
The Flow-Load Conversion tool is the orange button![]() on the bottom-left corner of the Rating Curve Data grid. It is common to collapse the data grid to provide more room for the plot (and less for a table of numbers). But you can only access the Load-Concertation conversion tool if the data are visible. If you hover over this button, it will expand to tell you what action it will perform (based on what state the data are in).
on the bottom-left corner of the Rating Curve Data grid. It is common to collapse the data grid to provide more room for the plot (and less for a table of numbers). But you can only access the Load-Concertation conversion tool if the data are visible. If you hover over this button, it will expand to tell you what action it will perform (based on what state the data are in).
![]()
![]()
Clipboard Import
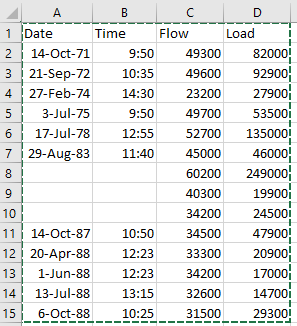
Users can also simply copy data from excel and paste it into the editor. The data must have the same four headings (Date, Time, Flow, Load), though not all the data are required. Copy the four columns from Excel. The select File→ Import → Clipboard. The tool will check if the clipboard data are in the correct format. If they are, it will provide the editor pictured above, allowing users to identify their sediment data type. If not, it will return an error, explaining that the format is not correct. An example of a good excel format is below:
Importing Data Files
The import tool can also import four data file formats.

The first two data formats are just extensions of the USGS Web importer. These are USGS data formats that can be downloaded from their website. These are useful if users already have USGS data downloads they want to use, but will mostly be replaced by the automatic web importer.
But the Rating Curve Analysis Tool does include two generic file formats that the model can import. These generic formats currently only support flow-load/concentration data, not load-gradation data. Sample files of each format are included below. You can download these and replace the data with your data to import data into the tool.

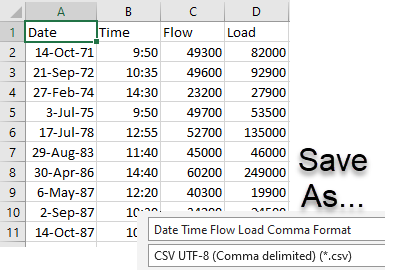
If you want to include data with just flow and load/concentration data, the file will still need the Date and Time columns, but they can be blank.


| File Format | |
|---|---|
Comma Delimited with Date/Time | |
Comma Delimited w/o Date/Time |

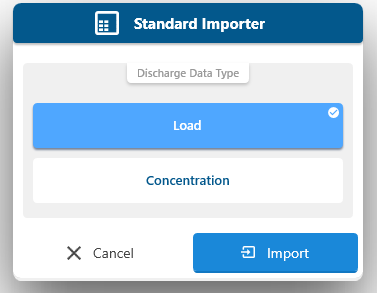
This importer will also allow users to specify whether the data they are importing are load or concentration before they import.
Warning - Remove Commas from Numbers for Comma Delimited Files
If you are creating a comma delimited file to import into the Rating Curve tool, be careful to format the numbers without commas.
Wish List - Other Water Quality Constituents
Now that HEC-RAS can download data directly from the USGS Water Quality sites, it will not be a major effort to expand the functionality to other constituents. We are looking to partner with water quality modelers who use these other constituents to understand how these methods transfer to other constituents.