Creating Time Series Icons
Time series icons display in the map window of HEC-RTS and indicate sites for which data and information are available. The information can be time series data, images, websites, webcams, scripts, spreadsheets, or other files. Time series data can appear as thumbnail plots or color bars. The icons provide easy access for analyzing data and providing location-specific information (e.g., frequently updated pictures of gages, reports on the location).
To create a time series icon:
- From the HEC-RTS main window (Figure 5.1), click the Setup module, from the Maps Windows Toolbar, click the Time Series Icon Tool
 .
.
- Find a location on the map window, hold down the CTRL key, and click the mouse, an icon will appear with a default name on the map window (Figure 9.3).
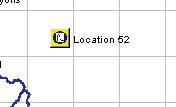
Figure 9.3 Creating a Time Series Icon
- To associate data with the new time series icon, right-click on the time series icon (Time Series Icon Tool should still be selected), from the shortcut menu, click Edit. The Time Series Icon Editor will open (Figure 9.4).
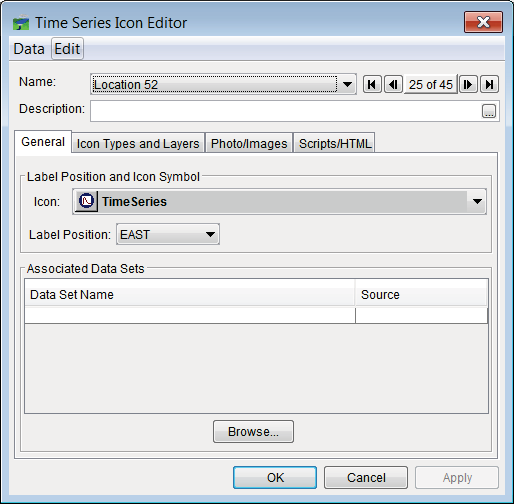
Figure 9.4 Time Series Icon Editor
- The user can modify/change the name, description, and icon symbol, as appropriate. To rename the time series icon, from the Edit menu (Figure 9.4), click Rename. The Rename Time Series Icon dialog box will open (Figure 9.5), from the Name box, the user can change the name of the selected time series icon.
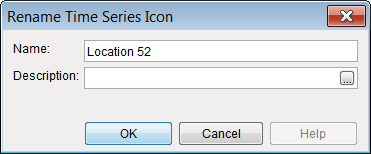
Figure 9.5 Rename Time Series Icon Dialog Box
- To associate datasets with a time series icon, from the Data menu (Figure 9.4), click Browse. A dialog box will open (Figure 9.6) that allows the user to select the datasets that will be associated with the time series icon.
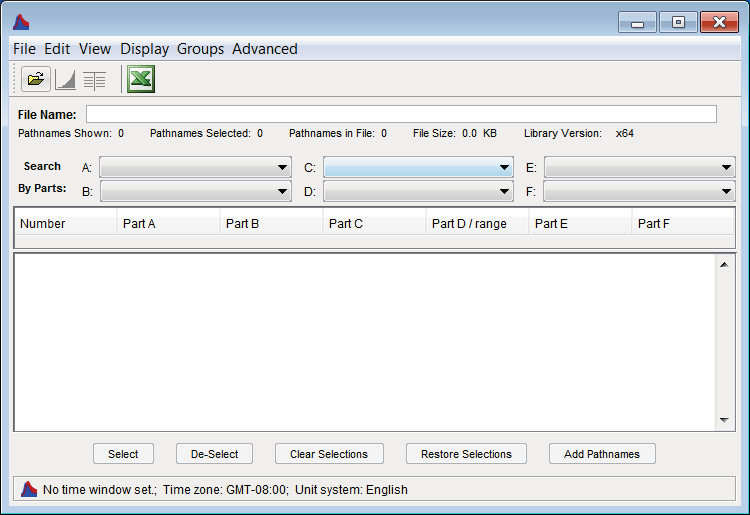
Figure 9.6 Dialog Box – Associating Dataset with a Time Series Icon
- If user wants to display modeling results from the time series icon, the user will need to select the forecast.dss file and select datasets from that file. The dialog box (Figure 9.6) will recognize the data as an alternative and ask the user if wild characters (%) are to be used in the F-part. This will allow the time series icon to display data from the current alternative, rather than the hardwired dataset.
- To setup the dataset icon types and layers, from the Times Series Icon Editor (Figure[ 9.7|#_bookmark146]), click the Icon Types and Layers tab. For the time series icon, from the Data Set
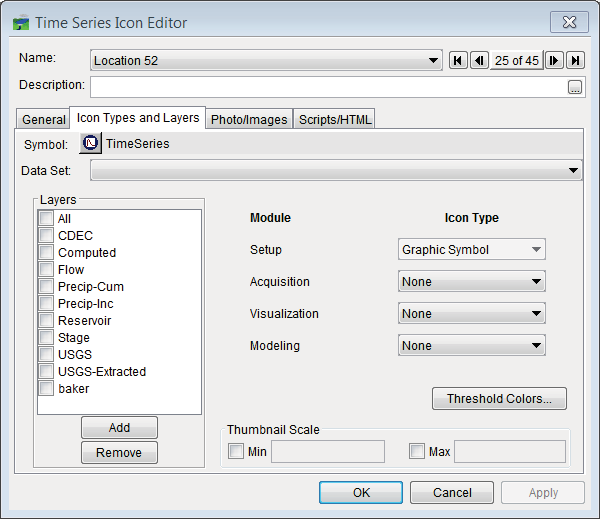
Figure 9.7 Time Series Icon Editor - Icon Types and Layers Tab
list (Figure 9.7) select a dataset. From the Layers box (Figure 9.7), select the layers that belong, and from the Icon Type list (Figure 9.7) for each module, select the icon graphic. Generally, the icon types correspond to the HEC-RTS module and are as follows:
-
- Acquisition: Quality Color Bar
- Visualization: Thumbnail Plot or Threshold Color Bar
- Modeling: Thumbnail plot or nothing
Make sure you have None selected for the type for model results in the Acquisition and
Visualization modules, as there is no modeling data in those modules.