To create a time series layer:
- From the HEC-RTS main window (Figure 5.1), click the Setup module, from the Maps menu, click Map Layers. The Map Layers dialog box (Figure 5.2) will open, right click on Time Series Icons, from the shortcut menu (Figure 9.1), and click Add Icon Layer.
- The New Time Series Icon Layer dialog box will open (Figure 9.2). Enter a name in the
Name box (e.g., Flow, Stage, or Precip). The user may enter an optional description in
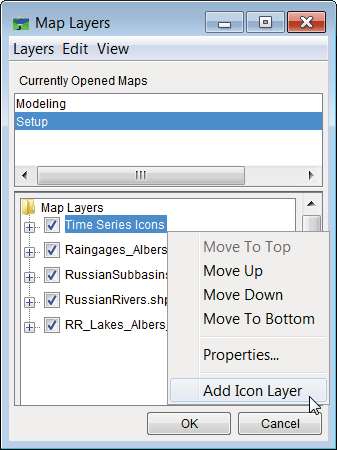
Figure 9.1 Map Layers Dialog Box – Time Series Icons Layer Shortcut Menu
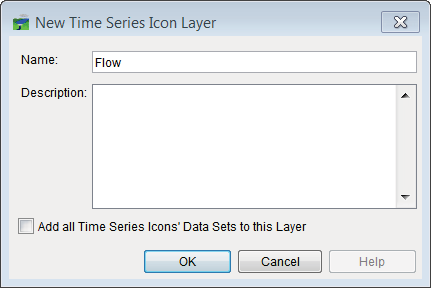
Figure 9.2 New Time Series Icon Layer Dialog Box
the Description box (Figure 9.2). If time series icons have been defined, and if the user wants all datasets to include all time series icons, select Add all Time Series Icons' data sets to this layer (Figure 9.2). Click OK, the New Time Series Icon Layer dialog box will close (Figure 9.2).