As an aid to evaluating observed data in the watershed database, and as an alternative to geo- referenced quality color bar icons, is the Data Status Summary List (Figure 10.8). This is essentially a list of quality color bars in a scrollable table format. The data status lists allow the user to organize a list of gages specific to the user's needs. For example, data status lists might be created that show all of the precipitation gages, stream gages, or a mix of both for a specific forecast. The user can create multiple data stats summary lists, as each list stored a separate text file.
To create or display a data status summary list, select Data Status Summary from under the
Reports menu on the Acquisition tab.
Selecting this menu will bring up an empty Data Status Summary dialog. From here, the user can go to the File menu and create a new list, open an existing list, or edit an existing list.
Generally, once datasets have been quality checked with DATCHK or similar, then the user can setup lists.
Creating a Data Status Summary list is relatively easy. From the Edit menu, select Browse DSS, select the pathnames of the datasets needed, then save that list under the File menu.
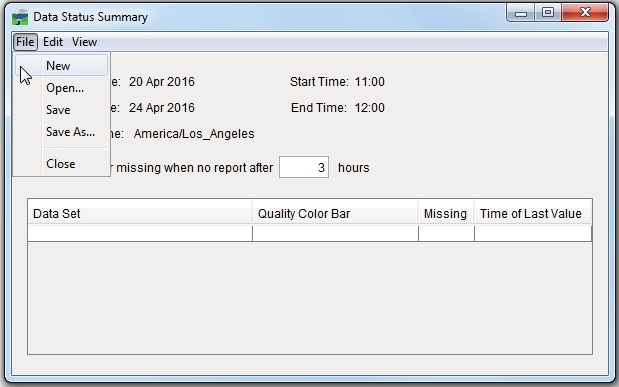
Figure 10.8 Data Status Summary Dialog Box