Gridded precipitation can be displayed and animated in the Visualization module after gridded datasets have been imported into the watershed database. To setup the display, go to the Visualization tab and click the Data Visualization menu, then Gridded Data and New Grid Set…. Give the dataset a name and click OK.
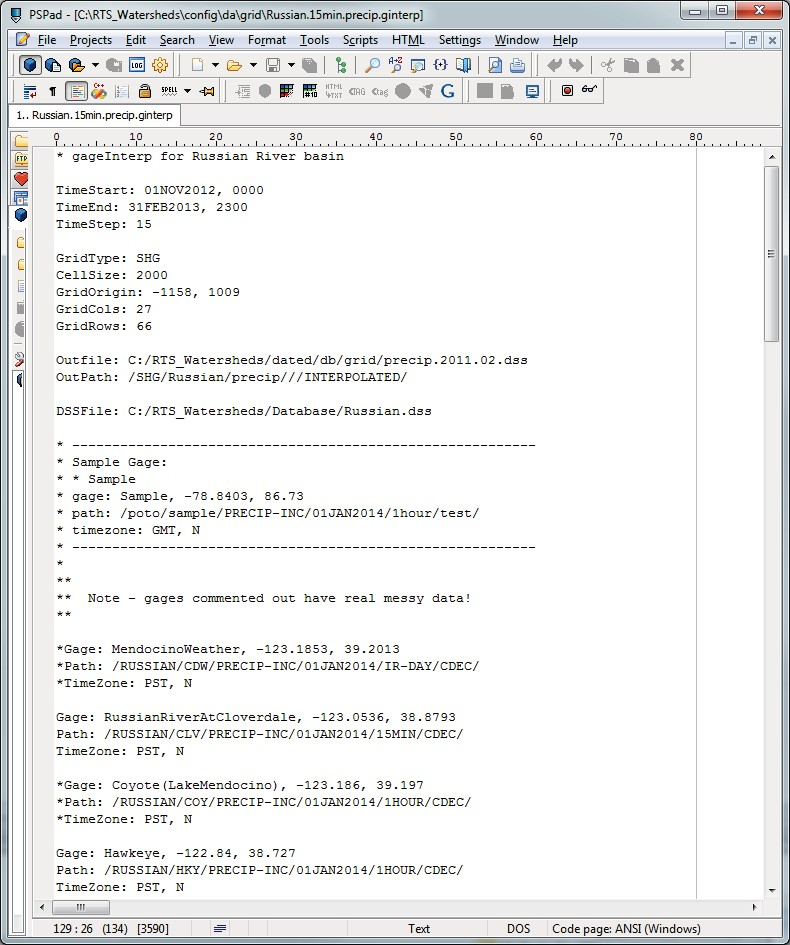
Figure 10.9 Sample gageInterp Input File
The HEC-RTS convention for gridded precipitation files is that they are named according to the year and month of the data and are in the following directory:
$RTS_HOME/dated/db/grid/parameter.yyyy.mm.dss This name is setup in the HEC-GageInterp input file.
From the new Grid Set dialog box, select one of the gridded DSS files from the Add File(s)
button. Then select the pathname parts to fill out the remainder of the dialog (Figure 10.10).
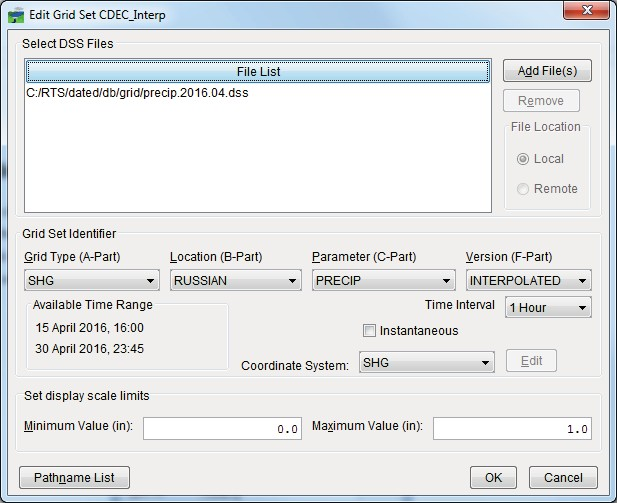
Figure 10.10 Edit Grid Set Dialog Box
After configuring the gridded dataset, the user can turn on the display of the gridded data, and animate the gridded data by selecting the name of the grid set from the Data Visualization menu. The date/times in the time panel specifies the grid set times.