Features of Plots
HEC-RTS plots offer data and results specific to the active module. The data that can be viewed was defined by the user in the Setup module at the time series icon locations. Modeling results can also be viewed at time series icons or at individual modeling elements (e.g., reservoirs). For example, in the Acquisition module, the plot for one time series icon might open a two- dimensional graph of incoming data at a specific location, while, in the Modeling module, the same time series icon might plot reservoir modeling results at that location (Figure 4.1).
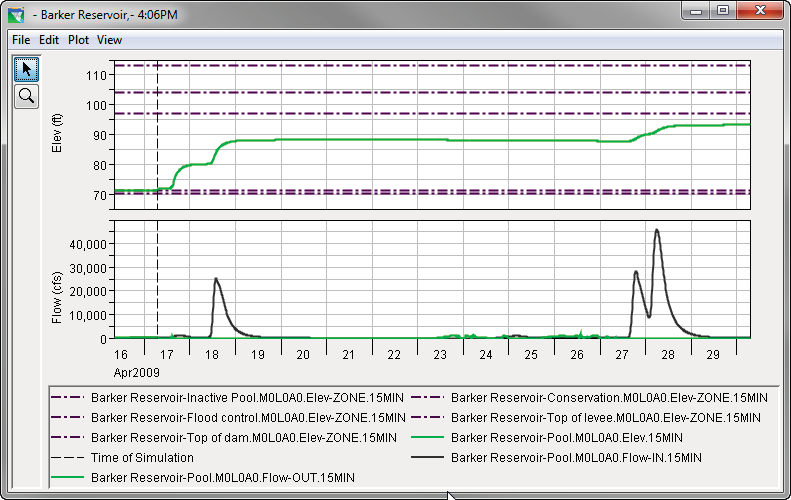
Figure 4.1 Sample Plot: Reservoir Modeling Results
The plot displays the location name in the title bar and has axis labels and a color-coded legend for the data contained in the plot. When a plot depicts results of a model alternative, as in Figure 4.1, a dashed vertical line represents the time of forecast. The Zoom Tool from the plot window operates the same as described in Section 3.3.2.
The user can customize the appearance of plots through the use of several editors. To access these editors, use the Select Tool and right-click on different elements of the plot (e.g., lines, axis). The user can also access these editors through the Edit and View menus in the Plot dialog box (Figure 4.1). The following provides an overview of the different editors (see Appendix I of the HEC-RTS User's Manual for more details on customizing plots):
Curve Properties |
Right-clicking on a plot curve or point allows the user to open a curve properties editor where curve colors, styles, and weights as well as labels and quality symbols can be edited. |
Viewport Properties |
Right-clicking on the viewport of a plot allows the user to open an editor where the border, background, and gridlines of the plot can be customized. |
Title Properties |
Right-clicking on a plot axis allows the user to open a title properties editor where the title of a plot can be customized. |
Axis Properties |
Right-clicking on a plot axis allows the user to open an axis properties editor where the axis scale and tic marks can be customized. |
Legend Properties |
Right-clicking on the legend of a plot allows the user to open an editor where the user can add a title and add icons and text to the left and right blocks of a plot. |
Label Properties |
Right-clicking on an axis label or plot legend allows the user to open a label properties editor where the user can add or change the background color of labels or add a border to the labels. |
Spacer Properties |
If multiple plots are available in the plot window, the user can right- click on the space between the plots to access the Space Properties Editor. From the Space Properties Editor adjustments can be made to the space between plots. |
Polygon Properties |
Right-clicking on a polygon allows the user to open a polygon properties editor where borders and backgrounds can be customized. |