The same data and information viewed from a plot can also be viewed in tabular form (Figure 4.2). As with plots, the type of data and results displayed depends on the properties the user defined for each time series icon.
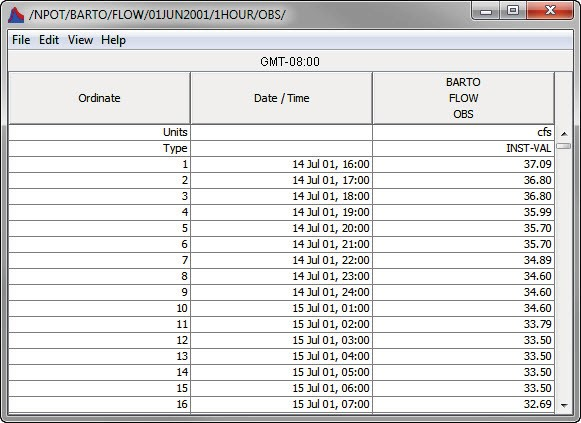
Figure 4.2 Data in Tabular Form
The appearance of tables can be customized through the use of commands available from the menu bar of the tabular form. The user can add commas; separate date/time into two separate columns; make the year four digits; specify the decimal precision of the data; show the quality of the data; show missing data as a value (e.g., -901.0); copy selected cells or the whole table; print; plot; resize the columns of the table; and export, the table to an ASCII file.