Time Series Icon Controls (Figure 3.6) allow the user to select the attributes for the time series layers that are displayed within the watershed. For time series icon controls panel to display, a time series layer must be created and data must be available for at least one of the time series icons associated with a time series layer. The tab is available in all modules, except the Setup module.
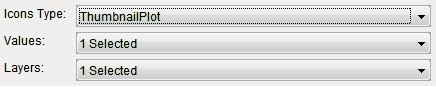
Figure 3.6 Time Series Icon Controls
Icon Type The Icon Type list (Figure 3.6) forces all icons within the map window to display as the selected Icon Type. The Default option in the list will display the time series icons for a watershed as they were set in the Setup module.
Value Allows the user to display the time series icon's data as labels (Figure 3.7), which displays next to or on the location of the associated time series icon. For
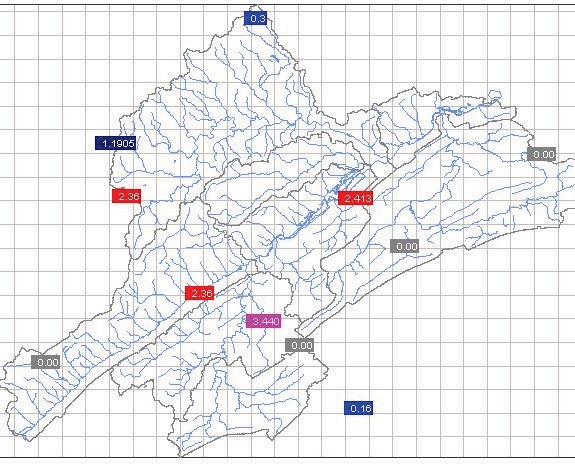
Figure 3.7 Time Series Icons - Value Labels
example, the user can choose to display the data's total, minimum, and maximum values as labels. Multiple values can be selected at once.
Layer Allows the user to select which layer or layers are visible in the map window.
Multiple layers can be selected at once.