Download PDF
Download page Modeling Runoff in Post-wildfire Snowmelt Basins.
Modeling Runoff in Post-wildfire Snowmelt Basins
Author
John F. Newton, john.f.newton@usace.army.mil
Acknowledgements
Thanks go to Jeremy Giovando from the U.S. Army Corps of Engineers (USACE), Engineering Research and Development Center, Cold Regions Research and Engineering Laboratory, and to Mike Bartles from the USACE Institute for Water Resources (IWR), Hydrologic Engineering Center, for providing ideas and insights, and for reviewing drafts. This work was completed as part of the USACE, IWR, New Horizons Program. Their support is greatly appreciated.
Abstract
After a watershed has burned, both the magnitude and timing of runoff change. In recent years, there has been growing interest in how wildfires affect watershed runoff. More research application has focused on modeling rainfall runoff in burned areas than snowmelt runoff, resulting in better guidance for rainfall modeling but a lack of guidance for snowmelt modeling. This report summarizes our current understanding of how burned vegetation and burned ground material affect snowmelt runoff, and it discusses how these impacts can be modeled using the Temperature Index Method in HEC-HMS. It also emphasizes the importance of considering rainfall and sediment hazards in snowmelt-dominated watershed.
To demonstrate parameter sensitivity, hypothetical scenarios were modeled in HEC-HMS, adjusting the following parameters: meltrate, cold rate coefficient, ATI-cold rate function, base temperature, and canopy evapotranspiration. Each parameter was adjusted independently by significant but realistic amounts. We analyzed 1,786 combinations of subbasins and weather conditions in a mountainous watershed to demonstrate how sensitive snow water equivalent (SWE) and runoff are to these parameters. The findings suggest that all these parameters, except for reductions in canopy evapotranspiration, contribute to decreases in modeled peak SWE following a wildfire; reductions in canopy evapotranspiration increase peak SWE. Parameter impacts on runoff vary, but notable trends are highlighted, which seem to agree with the literature cited.
Introduction
Wildfire alters the vegetation landscape and soil properties of forests, resulting in. changes in to rainfall runoff, sediment loads, and snowmelt runoff, which can last many years. This document focuses primarily on changes to snowmelt runoff after a watershed has been burned, and how to model those changes in HEC-HMS. For HEC-HMS tutorials specific to post-wildfire rainfall runoff and debris flow, see Hydrologic Modeling and Debris Flow Estimation for Post Wildfire Conditions in the HEC-HMS Tutorials and Guides. Both the runoff and sediment load responses to burned watersheds tend to be significantly larger during rainfall events compared to snowmelt, sometimes resulting in radical increases to peak runoff. These radical changes in runoff result from reducing the infiltration and retention capacity of the watershed, and from sediment bulking (Kilgore, et al., 2023),. Whereas snowmelt runoff is influenced primarily by a change in vegetation, which results in changes to the snowpack energy balance.
What Causes Snow to Melt?
Snow melts when it is heated. Heat is the transfer of thermal energy. Energy can be transferred to snow by direct contact with liquids (rain), gases (air), or solids (such as the ground, vegetation, or other objects), or without contact via shortwave and long wave radiation. Everything emits longwave radiation (if its temperature is greater than absolute zero kelvin), including people, buildings, trees, the atmosphere, and clouds. Electromagnetic radiation is the transfer of energy from one object to another via electromagnetic waves, without direct contact. Shortwave radiation from the sun warms the earth during the daytime. And Longwave radiation continuously emitted from the earth's atmosphere results in a net cooling of the earths it at nighttime. Both longwave radiation (from within the earth and its atmosphere) and shortwave radiation (from the sun) melt snow. Snow has a natural defense against shortwave solar radiation. Fresh snow can typically reflects as much as ~90% of the shortwave radiation; however, as snow ages this defense diminishes to generally as little as around 40-50% (Anderson, 2006). The fraction of the shortwave solar radiation reflected is called albedo. Snow has no defense against longwave radiation – it absorbs almost all longwave radiation from warmer matter throughout the daytime and the nighttime (Anderson, 2006).
Heat can be grouped into two categories: latent heat and sensible heat. Latent heat is the energy exchanged during a phase change (such as water vapor freezing into ice) and does not result in a temperature change. Whereas sensible heat is not associated with a phase change but results in a change in temperature. Although energy transfer via shortwave and longwave radiation can contribute to either sensible heat or latent heat, the terms sensible heat and latent heat are frequently used in snowmelt literature only when referring to energy transfer during direct contact, i.e., these terms are not typically used when referring to energy transferred by radiation.
Direct energy transfer between air and snow is accelerated by wind because wind increases turbulent air exchange. As the snowpack alters the air temperature immediately above the snow surface, new air is mixed in, thus maintaining a temperature difference so energy can transfer. Similarly, air exchange drives moisture exchange. Immediately above the snow surface, the air is saturated at the temperature of the snow. If the air in the atmosphere has a higher vapor pressure (i.e., warmer air with higher water content) than the air at the surface, it will condense onto the snowpack as it mixes with the surface air. This phase change from water vapor to ice crystals results in a latent heat transfer to the snowpack, warming the snow (USACE (1956); see also Snowpack Mass and Energy Accounting (army.mil) in the HEC-HMS Technical Reference Manual). Snow mass can also be lost directly to the atmosphere and therefore never contribute to runoff. This happens through sublimation, which is when snow changes from a solid ice crystal state directly into a water vapor state, without passing through the liquid state. In this case, the phase change results in a latent heat transfer from the snowpack to the atmosphere, resulting in the snowpack cooling. Some of the snow intercepted by trees sublimates into the atmosphere before it can contribute to the snowpack. While trees provide an additional highly exposed surface for snow to sublimate from, they also shield the snowpack on the ground from incoming solar radiation.
Initially, the upper layers of the snow melt and water percolates down into the lower layers where it refreezes. Warm ground can also contribute to snowmelt in the lower layers. Melting and refreezing occur throughout the life of the snow, sometimes on a daily cycle. When the entire snowpack, from top to bottom, reaches 32 degrees Fahrenheit and the liquid water content is near maximum, such that it can conduct water as the snow melts, the snow is considered ripe. Traditionally, this has been considered to be near the point at which melted water is lost to runoff.
This brief discussion was intended to provide background information for the post-wildfire discussion following. For a more in-depth discussion about snowmelt, refer to Snow Accumulation and Melt in the HEC-HMS Technical Reference Manual and EM 1110-2-1406 Engineering and Design: Runoff From Snowmelt.
How Does Wildfire Alter the Snowmelt Landscape?
Wildfire alters vegetation and soil, which in turn influences energy exchange, snow accumulation, and soil infiltration. This can change runoff timing, volume, and magnitude.
Burned forests have less shade. The reduction in shade is a function of how completely the trees are burned, tree variety, forest density, sun angle (latitude), and topography (e.g. terrain relief and adjacent mountains). As shade is reduced, solar radiation absorbed by the snowpack increases. Charred wood Black carbon shed from burned trees also increases the amount of solar radiation absorbed by the snowpack, because it darkens the snow resulting in decreased albedo. On the other hand, burned forests produce less longwave radiation (because tree canopiess give off longwave radiation), with denser forests experiencing the greatest reduction. The net change in total radiation could be either positive or negative and varies throughout the season as the angle of the sun and the number of hours of sunlight change. South facing slopes are exposed to more solar radiation.
In addition to changes in radiation, energy exchange at the snow-air interface is accelerated as wind speed increases due to a loss of trees. Depending on the air temperature, this may be a positive or negative energy exchange. Increased wind also contributes to increased sublimation. In many regions, snow loss by sublimation is minimal. But sublimation is more significant in regions with low humidity and high wind speeds; warmer temperatures and increased radiation also contribute to sublimation. Snow intercepted by trees is more susceptible to sublimation because of increased wind and exposed surface area. For example, in the semi-arid Rocky Mountains of Colorado, Sexstone et al (2018) reported 28% of winter precipitation sublimating to the atmosphere over a 5-year period, with higher rates (35%) in the forested areas. Canopy sublimation was the dominant simulated sublimation flux in their study, accounting for 58% of total sublimation, with canopy sublimation rates being 3 times faster than sub-canopy sublimation. Molotch et al (2007) measured canopy intercepted sublimation rates in the Colorado Rocky Mountains to be 1.7 times greater than snowpack sublimation rates. Snow loss due to sublimation varies substantially by region. In the example above, with a 28% total loss to sublimation, about 16% of the winter precipitation would have been lost to canopy sublimation (the same study showed a 15% loss in open areas below the treeline, so if the trees were removed the total sublimation might be reduced from 28% to somewhere in the range of 16%). This implies that after a forest fire, the total seasonal water accumulation would increase because less water would be lost to the atmosphere. The increase in this scenario would likely be less than 16% because reduced albedo in the burned forest could increase snowpack sublimation at the ground level. Since canopy sublimation occurs during the accumulation season, when snow is on the trees, the peak seasonal SWE depth could increase after a forest fire. The peak seasonal SWE depth is defined as the annual maximum snowpack volume observed during that season and is measured as a snow water equivalent (SWE) depth of water.
When the net energy absorbed by the snowpack increases during the accumulation season following a forest fire, the peak seasonal SWE depth decreases, unless it is offset by an increase in accumulation from reduced canopy sublimation. In some cases, this can lead to a reduction in snow depth on south facing aspects but not on northern facing aspects, e.g. (Maxwell, Call, & St. Clair, 2019), or a reduction on south facing canopy edges or forest gap areas (Moeser, Broxton, Harpold, & Robertson, 2020). Peak SWE decreases in some watersheds and increases in others following a forest fire, and some sites may go up one year and down another year because of weather patterns. These changes can be difficult to predict because they are site specific. A synthesis of literature by Goeking and Tarboton (2020) showed more studies found an increase in peak SWE than a decrease. Yet analyses of burned and unburned SNOTEL sites shows that decreases in peak SWE are more common, although both increases and decreases in peak SWE were noted in most regions (Smoot & Gleason, 2021; Giovando & Niemann, 2022) Giovando and Niemann (2022) reported that peak SWE was more likely to go down at SNOTEL sites, by an average of 13% in the western United States, and Smoot and Gleason (2021) found statistically significant average 10-year mean reductions in peak SWE of 34 mm. Both studies showed that these trends can persist for more than 10 years while the forest recovers.
Arriving at accurate estimates for changes in peak SWE (and changes in melt-out date and melt rate discussed below) can be problematic. The average changes cited above are from studies where the authors attempted to control for interannual climate variability, but the exact same weather conditions never occur both before and after a wildfire, which results in some error that cannot be fully accounted for. In addition, SNOTEL sites are in open forest clearings which may not be representative of the watershed as a whole after a wildfire. Model studies, on the other hand, cannot simulate every variable influencing snowmelt in the field, and are therefore subject to error. Both high resolution physically based models and field measurements suffer from only being representative of the specific location studied, and considerable variation has been observed from one site to another. Post-wildfire snowmelt science is an emerging discipline and accuracy will improve with time.
The melt-out date, or snow disappearance date, is the date at the end of the snowmelt season when SWE depth has reached zero. If the rate at which snow melts were to remain unchanged, a reduction in peak SWE would result in an earlier melt-out date; an increase in peak SWE would result in a later melt-out date. However, melting rates do not remain constant after a forest has burned; both increases and decreases have been observed. Increases in melting rates contribute to earlier melt-out dates. Melt-out dates at SNOTEL sites in the Western United States were on average 9 days earlier for years following forest fires (Smoot & Gleason, 2021; Giovando & Niemann, 2022). At sites with high burn severity, which were associated with 3 mm/day increases in melting rates, the average melt-out date was 14-days earlier than it had been prior to the forest fires (Smoot & Gleason, 2021). However, both increases and decreases in melt-out date have been observed in the same region because changes in melt-out date are both site and weather dependent. Other studies have shown similar ranges in change in melt-out day without relying entirely on SNOTEL data, e.g., (Burles & Boon; McGrath, et al., 2023).
Changes in snowmelt rates can be substantial following a forest fire, sometimes doubling, e.g. (McGrath, et al., 2023), but they can also remain unchanged or decrease. Observed variability in changes from pre-fire to post-fire snowmelt rates at SNOTEL sites are illustrated in Figure 1 below (Giovando, Niemann, & Fassnacht, 2024). This figure assumes two snowmelt rates are used in the ATI function during the melt season, the first is slope 1 (beginning at the peak SWE date) and the second is slope 2. The burned forest melt rate is equal to the unburned forest melt rate multiplied by the slope ratio factor. The change point is the date (measured in ATI degree-days) at which the melt rate changes from an early season (slope 1) to a late season (slope 2) melt rate. Negative change point differences effectively increase the snowmelt rate for a portion of the season because negative values imply that the second (larger) snowmelt rate is used earlier in the season (i.e. at a smaller ATI).
Trees consume water (primarily groundwater), and that water is lost to the atmosphere via transpiration. Burned forests have reduced transpiration, resulting in more snow water volume available during the melting season. In many watersheds, losses due to transpiration are minimal. An example where transpiration consumes a significant portion of the snowmelt is located northeast of Fairbanks, Alaska. Field observations conducted by Young-Robertson et al. (2016) showed deciduous tree sites (dominated by Paper Birch) removing an average of 21–26% of seasonal snowmelt water, while the coniferous tree sites (Black Spruce) removed about 0.62–0.64%. This extreme transpiration was only possible because of tree type and because the snowmelt season coincided with the period when the trees were uptaking and storing water prior to leaf-out. Watersheds with earlier snowmelt seasons may melt-out prior to the uptake season, in which case additional transpiration volume would not be available to augment runoff if the watershed were burned. In addition to trees, other vegetation also influences transpiration volume, some of which can recover much faster than trees.

Trees consume water (primarily groundwater), and that water is lost to the atmosphere via transpiration. Burned forests have reduced transpiration, resulting in more snow water volume available during the melting season. In many watersheds, losses due to transpiration are minimal. An example where transpiration consumes a significant portion of the snowmelt is located northeast of Fairbanks Alaska. Field observations conducted by Young-Robertson et al. (2016) showed deciduous tree sites (dominated by Paper Birch) removing an average of 21–26% of seasonal snowmelt water, while the coniferous tree sites (Black Spruce) removed about 0.62–0.64%. This extreme transpiration was only possible because of tree type and because the snowmelt season coincided with the period when the trees were uptaking and storing water prior to leaf-out. Watersheds with earlier snowmelt seasons may melt-out prior to the uptake season, in which case additional transpiration volume would not be available to augment runoff if the watershed were burned. In addition to trees, other vegetation also influences transpiration volume, some of which can recover much faster than trees.
The synthesis of literature by Goeking and Tarboton (2020) reported that most studies showed an increase in peak flow following forest disturbance. They cited studies that suggest the increase in peak flow may be due to increased synchronicity of snowmelt timing throughout the watershed rates, rather than increased volume or increased snowmelt rates. If snowmelt were asynchronous by elevation across a watershed prior to a forest fire, then post-fire snowmelt could become more synchronized. Goeking and Tarboton (2020) generally observed decreases in seasonal water yield in areas with high total radiation and high solar radiation (i.e., at low latitudes and south-facing aspects), and in areas with rapid growth of post-disturbance vegetation. Evaporation rates and snowpack (not canopy) sublimation rates increase after a forest is burned due to increased wind and solar radiation, which can reduce seasonal water yield. Peak flow does not necessarily go down when seasonal water yield goes down or up when seasonal water yield goes up because volume may shift toward the low flow or high flow season. An increase in runoff volume during the peak flow season also might not translate to an increase in peak flow if the basin becomes less synchronized.
Reduced infiltration rates can increase rainfall runoff in burned watersheds, but studies have not been done evaluating the effects of reduced infiltration on snowmelt runoff. While snowmelt infiltration rates may be reduced following a forest fire, snow melts at lower rates than short duration intense rainfall. As a result, in some watersheds large reductions in infiltration rates may be required for snowmelt to exceed infiltration rates. These watersheds might not be influenced by reduced infiltration. Watersheds with frozen ground also will not be impacted. Watersheds that are impacted could experience either a reduction or increase in peak flow, depending on how seasonal runoff timing is affected. Watersheds with intense rain-on-snow events would likely be affected but it is difficult to quantify the magnitude of the impact since long-term saturated ground from snowmelt could influence infiltration rates and this has not yet been studied.
Due to site-specific variability in post-wildfire runoff, modeling may be necessary to draw conclusions about potential effects of forest fires on watershed runoff. Some watersheds will have negligible impacts while others may generate flood hazards or snow water storage deficiencies. It may not always be possible to accurately predict wildfire impacts, but it is possible to parameterize the hazards. The sections following outline possible approaches.
Determining the Dominant Flooding Hazard(s)
In snowmelt-dominated watersheds there are three primary contributors to runoff volume that might increase after a watershed has been burned: 1) rainfall, 2) sediment, and 3) snowmelt. Following a wildfire, the infiltration and retention capacity of the watershed are reduced, and surface runoff paths and resistance are altered, which can result in remarkable increases in rainfall runoff. The increased runoff is accompanied by increased sediment loads, and in some situations the increased runoff can trigger debris flows. The change in vegetation alters the snowmelt energy balance, which can result in either an increase or decrease in peak snowmelt runoff, and a shift in snowmelt timing. Impacts to rainfall runoff are much more pronounced than the impacts to snowmelt runoff. An important part of assessing flood hazards in burned watersheds is determining the dominant flood hazard(s). This document addresses snowmelt flood hazards, but rainfall and sediment flood hazards are mentioned briefly here because sometimes snowmelt is no longer the dominant flood hazard after a wildfire.
Rainfall or Snowmelt Runoff Dominance
In basins where the peak runoff during the rainfall season runoff is significantly smaller than the peak runoff during the snowmelt season runoff, flood risk analysis is commonly restricted to the snowmelt season. This is justified by assuming that if the system can handle the much larger snowmelt peak flows, it can also handle the rainfall runoff. After a watershed has been burned, peak rainfall peak runoff often increases more than peak snowmelt peak runoff, shifting the basin away from snowmelt dominance dominated peak flows toward rainfall dominancedominated peak flows. For example, lower intensity rainfall events in the West Fork of Willow Creek in eastern Arizona produced significantly higher peak runoff following a wildfire than they did prior to the wildfire, while no change in snowmelt peak runoff was discernable (Wagenbrenner, 2013). Pre-wildfire peak flows in this basin were typically associated with snowmelt, but Wagenbrenner classified this basin as having bimodal post-wildfire hydrology. Basins with flood hazards generated dominantly by snowmelt runoff can sometimes become dominated by rainfall-dominated basins hazards following a wildfire; or both types of events might become significant. The basin can experience changes in both the peak runoff magnitude and the timing of the peak runoff season. If rainfall becomes the dominant post-wildfire flood hazard, it might be possible to omit the snowmelt analysis in some basins; in other basins it might be necessary to consider both.
Sometimes the most dominant flood hazard is a combination of both rainfall and snowmelt. During a rain-on-snow event, rainfall is either retained within the snowpack or passes through the snowpack, or a combination of both. The combination of rainfall and snowmelt has the potential to produce a larger peak flow than rainfall alone. However, depending on the snowpack conditions, the snowpack may delay or retain the rainfall enough to produce a smaller peak flow than rainfall on a snow-free landscape. General snowpack-rainfall interactions are not expected to change significantly following a wildfire, but this has not been studied. If this is true, a detailed understanding of these interactions may be unnecessary. However, when wildfires result in an earlier melt-out date, the rain-on-snow season would become shorter.
Ground infiltration rates may be reduced following a wildfire, which could increase runoff. Unfortunately, little is known about the magnitude of the potential change in snowmelt environments. The effects of continuous snowmelt on saturated soil infiltration rates in burned watersheds have not been studied. If the ground is frozen, infiltration rates would not change between pre-wildfire and post-wildfire conditions. Unfrozen ground Infiltration rate reductions applied to a rainfall-only post-wildfire analysis might be too aggressive for a rain-on-snow analysis.
Rainfall runoff flows through preferential paths both higher within the snowpack and overland at the ground surface. The flow paths are influenced by snowpack characteristics, land features, and vegetation. If the flow resistance is dominated by the snow, then there will likely be little change following a wildfire; however, if the resistance is dominated by vegetation, notable changes in resistance could occur. While the magnitude of the vegetation impacts on flow resistance are basin-specific, wildfires are expected to induce less changes in flow resistance for rain-on-snow events than would be expected with direct rainfall on a snow-free landscape.
Reduced vegetation uptake following a wildfire results in increased runoff irrespective of whether the runoff is generated by rainfall, snowmelt, or both. The magnitude of the increase is determined by the vegetation growth season and soil moisture. Some loss methods implemented in HEC-HMS implicitly account for vegetation uptake within the method (e.g. SCS method), while other loss methods require a separate canopy method to account for evapotranspiration (e.g. Deficit and Constant method).
Sediment
Intense rainfall impacting the soil surface increases hillslope erosion. As runoff accumulates in rills, gullies and streams, significant volumes of sediment can be transported downstream. Snowmelt runoff also transports sediment, but since rain can fall at a much faster rate than snow can melt it has the potential to generate faster overland flow with higher transport capacity. However, since snowmelt can be more widespread, it sometimes results in higher streamflow. Subsurface flow, common in snowmelt environments, cannot generate surface erosion. But when the soil is saturated and snowmelt rates exceed infiltration rates, surface runoff and erosion occur. Freeze-thaw cycles make the soil looser and more porous, which increase both the soil erodibility and the infiltration rates (Wu & Fang, 2024). Frozen ground layers below the soil surface can prevent infiltration, thus increasing the runoff. In some regions the increased runoff from subsurface frozen ground and the increased surface erodibility can result in snowmelt erosion rates being as high as summer storm rates (Weigert et al., 2003 cited in Wu and Fang 2024); although, rainfall erosion rates are generally higher than snowmelt erosion rates. Snowmelt runoff usually has less transport capacity than rainfall because of lower overland flow rates, resulting in more sediment depositing in gullies, whereas rainfall transports a larger fraction of sediment downstream (Wu & Fang, 2024).
Vegetation protects hillslopes and streambanks from the erosive forces of runoff. Additionally, vegetation, litter, and decomposed organic matter shield the soil surface, dissipating the energy from falling rain drops. Burned watersheds lose more soil to erosion than unburned watersheds because these protective layers are consumed by the fire (Neary, Daniel G.; Ryan, Kevin C.; DeBano, Leonard F. eds, 2005). A lack of litter, trees, shrubs, and other vegetation also reduce the amount of rainfall intercepted and stored on plants, which increases the net runoff and hence soil erosion.
Vegetation also protects the soil from snowmelt runoff. But snowmelt soil erosion rates are high in early spring before vegetation establishes itself (Wu & Fang, 2024). Since vegetation provides less protection during the snowmelt season, snowmelt soil erosion is less likely to be impacted by wildfires than rainfall erosion; although, studies have not been done to confirm this. When snow is sufficiently deep it absorbs rainfall impact, reducing the surface disturbance. As a result, soil erosion in a burned watershed is expected to differ less from its unburned state during a rain-on-snow event than a rain on snow-free ground event. However, the absence of canopy cover in burned watersheds increases the available rainfall and alters how the rainfall impacts the snowpack. Differential snow settlement under rain-on-snow events contribute to preferential paths within the snowpack which accelerate percolation rates (Singh, Spitzbart, Hübl, & Weinmeister, 1997). It is not clear if these preferential paths would be influenced by the lack of canopy cover in a burned watershed.
Debris flows have the potential to cause more damage than sediment laden runoff. Debris flows can initiate when mass from a slope failure mixes with runoff, or when the flow is fast enough to mobilize extreme amounts of sediment. Both mechanisms can be initiated by intense rainfall or intense snowmelt. Intense rainfall accumulating in gullies can entrain and transport loose bed deposits, transforming into debris flows, but it is relatively uncommon for debris flows to form from direct snowmelt runoff without slope collapse (Liu & He, 2023) although it does occur (Mostbauer, Kaitna, Prenner, & Hrachowitz, 2018). Debris flows more commonly occur when channel side slopes become unstable and collapse from side slope scour by rainfall or snowmelt driven flow (Liu & He, 2023); debris flows also occur during rain-on-snow events (Mostbauer, Kaitna, Prenner, & Hrachowitz, 2018).
Snowmelt-induced debris flows on burned watersheds have not been studied. However, there are numerous rainfall-induced debris flow studies on burned watersheds. Reduced infiltration in burned watersheds increases the runoff volume, and loss of vegetation increases erosion and runoff rates. The intensity and duration of wildfires influence how much the soil properties change and how much protective vegetation cover is reduced (Staley, et al., 2017). As runoff and sediment yield increase, the likelihood of rainfall-induced debris flow increases. Staley et al. (2016; 2017; Kean & Staley, 2021) found that during high intensity rainfall events in Southern California, debris flow likelihood increased in burned watersheds if the slopes were both greater than 23 degrees and burned at moderate or high burn severity. Debris flows are less likely the second winter season after a fire (Cannon et al., 2008 cited in Kean and Staley 2021).
Rainfall-induced debris flows increase following a wildfire because both runoff and available sediment increase. Peak snowmelt runoff is significantly less likely to increase following a wildfire than rainfall runoff, and sediment increases are likely more modest than expected during rainfall events. As a result, increases in snowmelt-induced debris flows are probably less likely than increases in rainfall-induced debris flows.
Additional research is needed to assess how much wildfires impact rain-on-snow initiated debris flows.; part of the uncertainty likes in determining how much the flowrate might increase. Some rain-on-snow induced debris flows result from surface and channel erosion while others are associated with shallow landslides. Debris flows supplied by eroded sediment are likely to increase if runoff increases. Whereas snowmelt-induced debris flows caused by shallow landslides, likely require an increase in soil moisture to increase debris flow risk.
Both the rainfall and snowmelt seasons should be evaluated for potential increases in debris flow hazards following wildfires, along with increases in runoff due to increased sediment bulking. Special attention should be given to areas with steep slopes (e.g. greater than 23 degrees) that are burned at moderate or high severity, and to areas that have previously been known to have debris flows. If the post-wildfire snowmelt analysis shows and increase in flow, then an increase in sediment load and debris flow hazards should be assumed, although it may be difficult to quantify.
Resources
Soil burn severity is a classification of how a fire affected the ground surface, based on fire-induced changes in soil properties (Parsons, Robichaud, Lewi, Napper, & Clark, 2010). Soil burn severity and the percentage of the watershed burned are required inputs for most methods used to estimate post-wildfire rainfall runoff. Burned Area Emergency Response (BAER) teams, generally from the U.S. Department of Agriculture (USDA) Forest Service or U.S. Department of the Interior (DOI), conduct post-fire assessments shortly after large wildfires occur (Parsons, Robichaud, Lewi, Napper, & Clark, 2010). Soil burn severity maps are created as part of this assessment as quickly as possible after the fire to help assess risk. Soil burn severity maps can be used to help assess changes in infiltration and erosion potential. The website for downloading these maps is provided below. After the soil burn severity maps have been created, the U.S. Geological Survey (USGS) conducts a post-fire debris flow hazard analysis.
Since this document focuses on snowmelt, the effects of wildfires on rainfall runoff and sediment transport were only touched on briefly, but additional resources are provided below. Many of the resources below focus more heavily on rainfall runoff, but some of the resources are also helpful for snowmelt or rain-on-snow analysis.
- Soil Burn Severity maps developed by BAER teams: https://burnseverity.cr.usgs.gov/baer/baer-imagery-support-data-download
- Methods used by BAER teams to estimate peak post-wildfire rainfall runoff: https://forest.moscowfsl.wsu.edu/BAERTOOLS/ROADTRT/Peakflow/
- BAER Burned Area Reports database: https://forest.moscowfsl.wsu.edu/cgi-bin/BAERTOOLS/baer-db/index.pl
- Other resources used by BAER teams: https://forest.moscowfsl.wsu.edu/BAERTOOLS/
- USGS post-fire debris flow hazard assessments: https://www.usgs.gov/programs/landslide-hazards/science/postfire-debris-flow-hazards#overview This method uses rainfall intensity, soil burn severity, and slope (greater than 23 degrees) to estimate the likelihood of rainfall-runoff initiated debris flows in burned watersheds.
- A brief list of tools for modeling hydrology and erosion are provided in HEC-19 FHWA 2023 – "Highway Hydrology: Evolving Methods, Tools, and Data; Section 7.1 Wildfires and Runoff" along with other resources including many of the resources already cited herein (https://www.fhwa.dot.gov/engineering/hydraulics/library_arc.cfm?pub_number=2&id=187). HEC-19 does not discuss snowmelt, but the WEPP model cited in HEC-19 has some snowmelt erosion modeling capabilities (Wu & Fang, 2024).
- HEC-HMS tutorial on post-wildfire rainfall runoff and debris flow: https://www.hec.usace.army.mil/confluence/hmsdocs/hmsguides/hydrologic-modeling-and-debris-flow-estimation-for-post-wildfire-conditions
- Post-wildfire recovery resources: https://www.nwcg.gov/partners/pwrp/resources
- A compilation of post-wildfire literature, models, and data are available at the Urban Flood Demonstration Program (UFDP) Data Clearing House (https://ufdp.dri.edu/)
Using the Temperature Index Method to Model Post-wildfire Snowmelt Runoff
The Temperature Index Method (also known as the Degree-day Method) uses air temperature as an index, or proxy, for all energy sources available to heat or melt a snowpack. Some temperature index methods implementations use an average air temperature as a statistical index to the physical energy sources, while other methods use a maximum daily air temperature or both a maximum daily and minimum daily air temperature (EM-1110-2-1406). Within the HEC-HMS Temperature Index implementation, the temperature index is taken as the difference between a base temperature (generally near 32 °F if an average air temperature is used) and the air temperature at all computational time steps. The index is multiplied by a melt-rate coefficient (also called the degree-day factor) to estimate the energy flux into/out of the snowpack. The coefficient is simply a melt rate per degree per day. In HEC-HMS, if an ATI Function is used, the melt rate varies with a Meltrate Antecedent Temperature Index (ATIMR), which is the temperature index accumulated over time (or accumulated degree-days). Accumulating the temperature index over time makes it possible to assign different melt rates throughout the season. Changing the melt rate as the season progresses indirectly accounts for other phenomena like solar radiation and changes in albedo, which change with the season. No snowmelt runoff is generated until the entire snowpack reaches a temperature of 32 def F. The amount of energy required for the snowpack to reach 32 deg F °F is called the cold content. HEC-HMS uses a separate accumulated temperature index, called Antecedent Temperature Index for Cold Content (ATICC), in conjunction with an empirical relationship to estimate the cold content at any given time in the model. ATICC is an index proxy for the temperature of the near-surface layer of the snow, accumulated over time, and is a function of air temperature. For a more complete discussion of the Temperature Index Method, refer to the HEC-HMS Technical Reference Manual (Temperature Index Method (army.mil)).
The purpose of this brief discussion was to highlight the fact that the Temperature Index Method uses a single measured variable, air temperature, to account for all energy fluxes. The only other data input into the model is precipitation. We would not expect perceivable changes in air temperature or precipitation after a wildfire. As a result, post-wildfire input data do not account for any of the wildfire impacts. Therefore, parameter modifications may be necessary after a wildfire. However, every parameter does not need to be (and should not be) recalibrated modified after a wildfire. The parameters that are most relevant to wildfire impacts are discussed in this section.
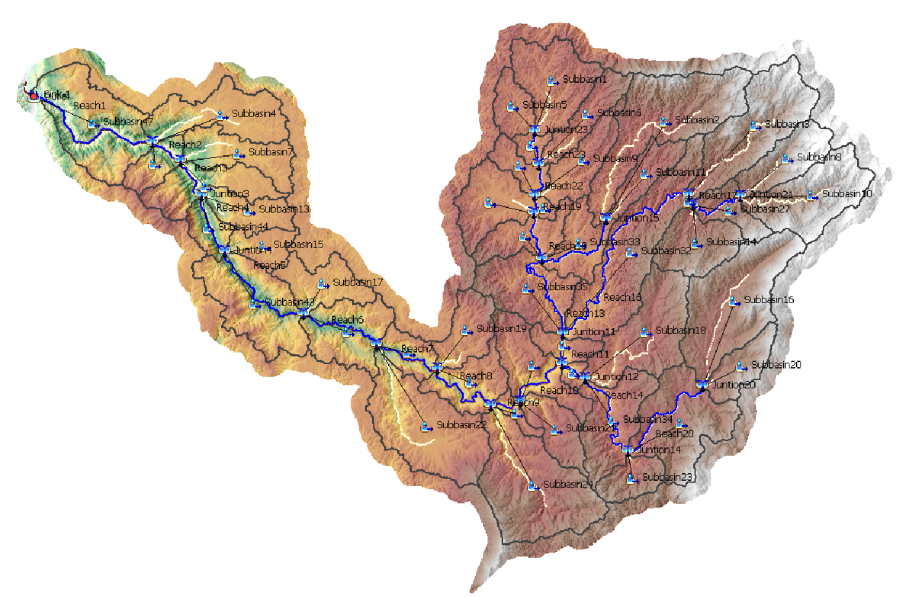
Only modeling parameters used by the Temperature Index Method are discussed here. Changes in these parameters would likely be a function of pre-fire tree density, distribution, height, and type, burn severity, and slope aspect. For each parameter, a hypothetical scenario has been modeled with what would be considered a significant or worst-case change for that parameter. Two HEC-HMS models of the Lolo Creek watershed in Northern Idaho were used. The first model is a single basin model, and the second model is a multi-basin model with 47 subbasins, most of which are between 1 and 12 square miles. The Lolo basin, depicted in Figure 2, has an area of 240 sq mi and a basin relief of about 5,000 ft, with a maximum elevation of about 6,000 ft. Runoff in the Lolo Creek watershed is generated from spring snowmelt, winter rain-on-snow, and spring rain-on-snowmelt. For consistency, each subbasin uses the same snowmelt modeling parameters. However, the response varies between subbasins because of changes in gridded temperature and precipitation. In addition, 38 water years were simulated from 1984 to 2021. As a result, the final output considers 1,786 different historical weather patterns (38 water years x 47 subbasins). The 38 water years were run as one continuous simulation, but the moisture deficit naturally resets to zero every year sometime prior to the next year's spring runoff, and ATI also resets between water years since SWE melts out every year. The basins also naturally reset during the continuous burned simulations.
Dry Melt Rate or ATI-Meltrate Function
Justification: Late season increases in post wildfire snowmelt rates are more common than decreases in northern ecoregions (Giovando, Niemann, & Fassnacht, 2024), but the response is site-specific. The increases in meltratemelt rates are attributed to increased solar radiation, decreased albedo, and increased wind. However, it is also possible for them to decrease or remain the same, likely due to reduced longwave radiation.
Considerations: Throughout the snowmelt season, the meltratemelt rate changes, with late snowmelt season rates tending to be larger than early snowmelt season rates. Giovando et al. (2024) showed that during the snowmelt season (i.e. the season from peak SWE to snow disappearance) SNOTEL sites tend to have two dominant meltratemelt rate periods, corresponding to an early and late snowmelt season. They showed lesser impacts to the early-season meltratemelt rate. One possible approach to modeling, is only adjusting the magnitude of the late-season melt- rate and leaving the early-season meltratemelt rate unchanged. This is a conservative approach since it leaves more snow available for melting during the latter more intense melting seasons. For some basins, it might be justifiable to change the date at which the late-season meltratemelt rate begins. For example, reducing the ATI corresponding to the beginning of the late-season meltratemelt rate, shifts the higher meltratemelt rate period earlier in the snowmelt season.
Increasing the dry melt rate could make it larger than the wet melt rate. This is likely not an appropriate assumption, particularly during the early season, because HEC-HMS uses the wet melt rate whenever the rain rate limit is exceeded. Since there does not seem to be good physical reasoning for increasing the wet melt rate following a wildfire, the wet melt rate could be used as a ceiling for capping increases in the dry melt rate. In some cases, it may be necessary to reassess the wet melt rates in the pre-fire model. For the meltratemelt rate scenario discussed below the dry melt rate was not capped at the wet melt rate value because only 4 out of the 1,786 subbasin/water year combinations were impacted (i.e. high ATIMR occurred at the same time as high precipitation rates).
Increasing the meltratemelt rate by a smaller amount (or not at all) during the snow accumulation season could compensate, to some extent, for sublimation being neglected in the Temperature Index Method. Canopy snow sublimation occurs primarily during the accumulation season while snow persists in the trees and would be reduced because of reduced canopy cover. Furthermore, many studies only compute melt rates during the snowmelt season, resulting in some uncertainty as to whether or not melt rates increase by similar magnitudes during the accumulation season.
Range: Increases in dry melt rates up to 300% (Burles & Boon, 2011) have been documented in current post-wildfire literature. Figure 1 shows less extreme increases in dry melt rates; some basins have decreasing melt rates, although most decreases are not statistically significant.
HEC-HMS Hypothetical Scenario: Meltrate
For this scenario, meltrates were doubled while ATI was unmodified, as shown in Figure 3.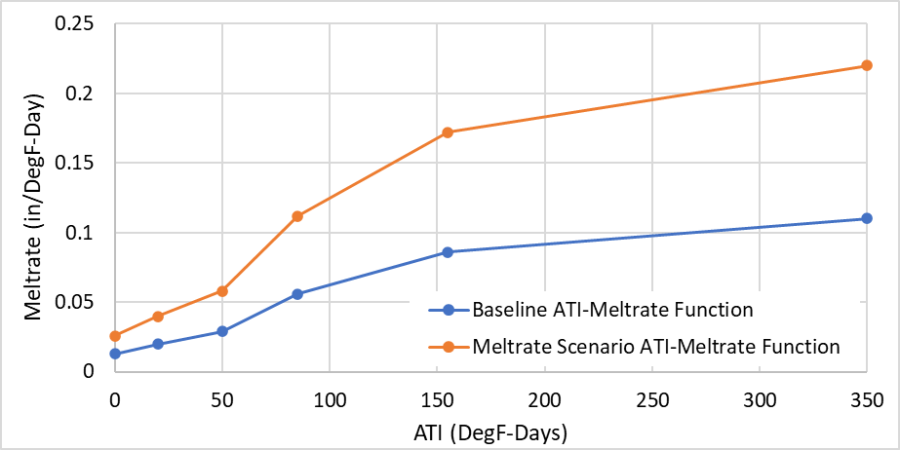
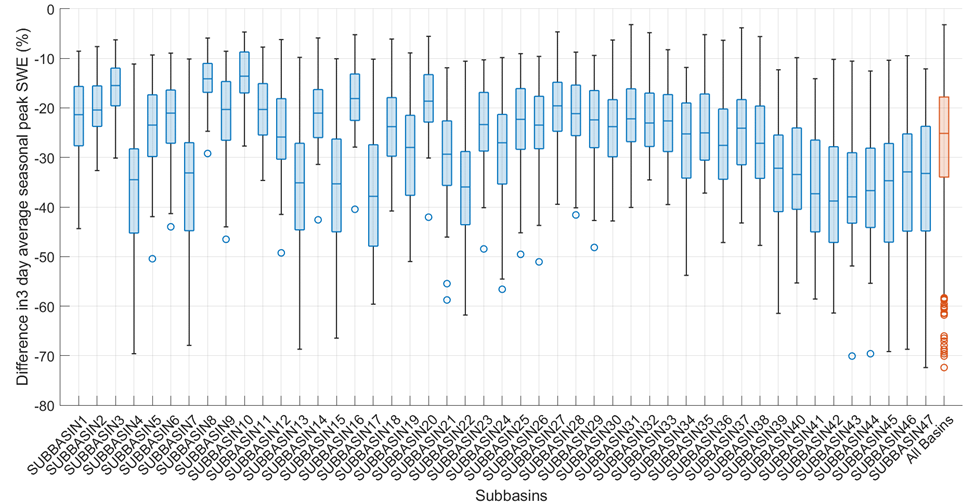
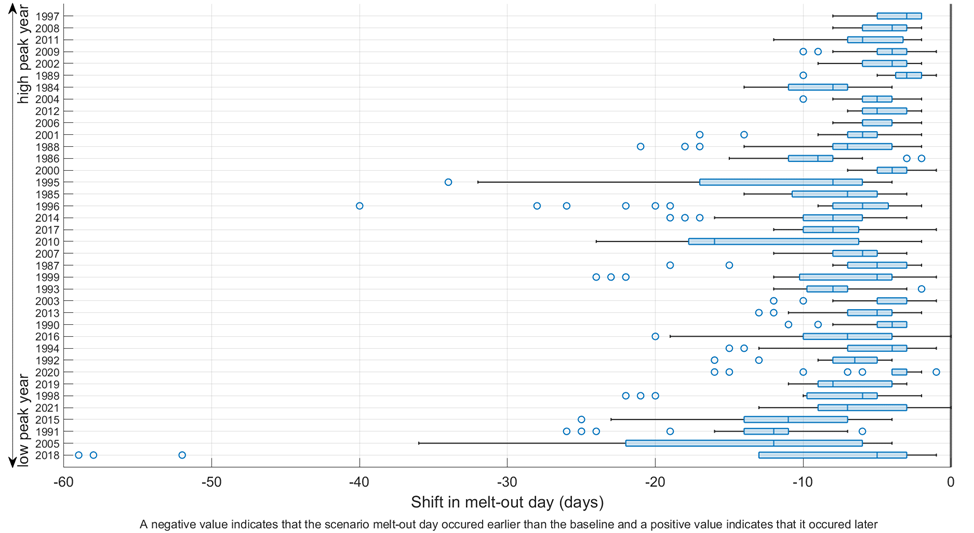
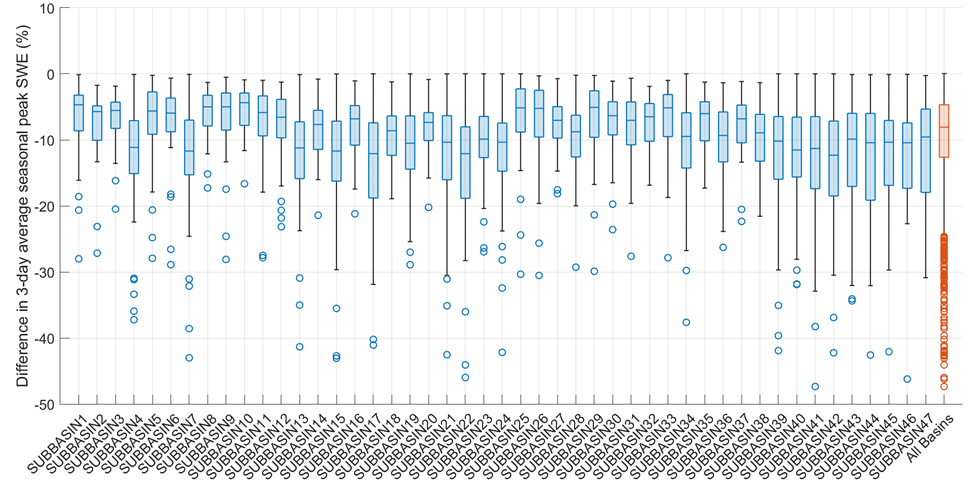
Figure 4 shows the change in the peak seasonal SWE resulting from increasing the meltrate. The peak SWE is reduced for every basin and every water year, with a median reduction of 9% (average of 11%), as illustrated by the red boxplot. Figure 5 shows the same data, but grouped by water year, to show basin variations for individual water years. The magnitude of the change in peak SWE is within the range of pre and post burn SWE observations documented in literature. Increasing the meltratemelt rate decreases peak SWE. However, there are some studies that have shown increases in observed peak SWE following wildfires. This implies that changing the meltratemelt rate cannot by itself fully account for burn impacts. Increases in peak SWE have sometimes been attributed to reduced sublimation, due to reduced canopy interception. HEC-HMS does not model sublimation when using the Temperature Index Method. The actual SWE depths used to create Figure 4 and Figure 5 are shown in Figure 6 for context.


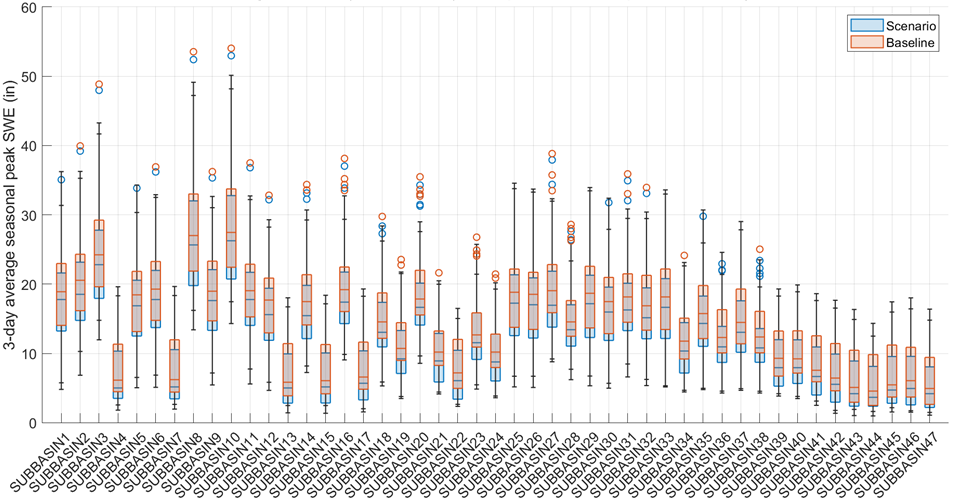
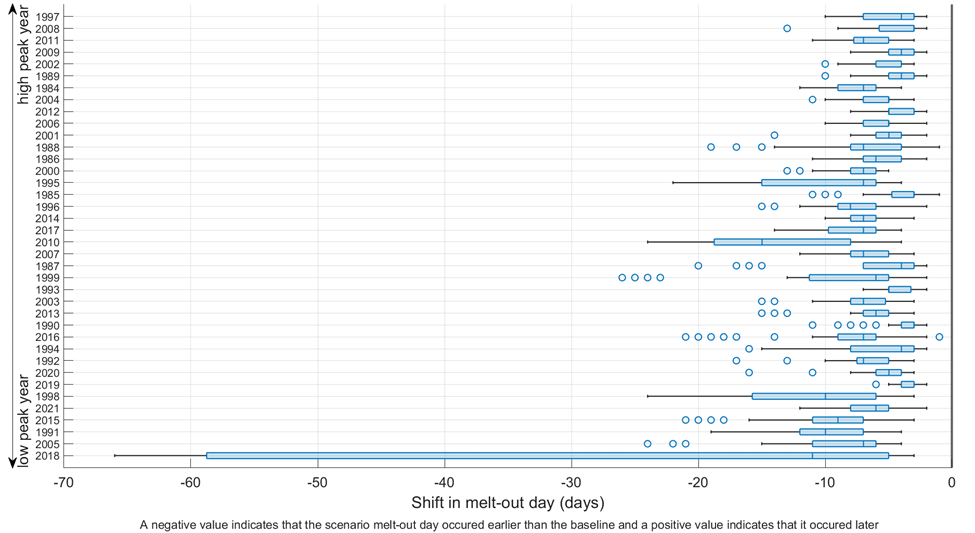
Figure 7 shows that the melt-out date shifts earlier in the season by a median of 11 days (average of 13 days). Years with low peak SWE (bottom of the figure) tend to have greater deviations, which in some cases was due to multiple SWE peaks during the season (e.g., 2018). To mitigate for this, when the peak SWE for a given basin was less than 3 inches, it was omitted from the plot, which filtered out less than 2% of the data. The magnitude of the shift in melt-out date appears to be comparable to published values.
Figure 7 shows that the melt-out date shifts earlier in the season by a median of 11 days (average of 13 days). Years with low peak SWE (bottom of the figure) tend to have greater deviations, which in some cases was due to multiple SWE peaks during the season (e.g., 2018). When the peak SWE is low, sometimes a subbasin can melt out temporarily during the winter, followed by more snow. This generates a second peak SWE. If the first peak SWE is larger during the baseline run, and the second peak is larger during the scenario, this results in a less meaningful shift in the melt-out date because the melt-out date was defined as the date following the largest peak SWE. Fortunately, dual peak SWE years are uncommon in this watershed. To mitigate for this, when the peak SWE for a given basin was less than 3 inches, it was omitted from the plot, which filtered out less than 2% of the data. The magnitude of the shift in melt-out date appears to be comparable to published values.

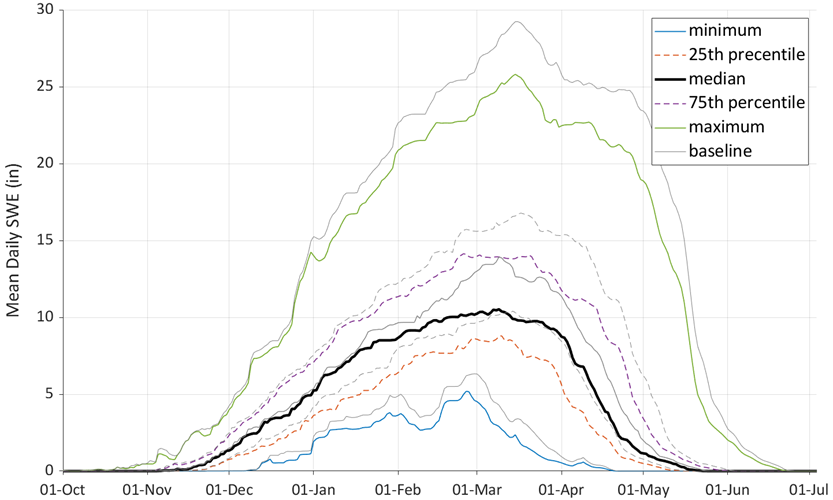
Figure 8 shows the SWE percentile depths for each day of the year, for water years 1984 to 2021. This figure was created from a single basin model that spanned the entire Lolo basin. While some of the snowmelt parameters in this model differ from those in the multi-basin model, the ATI-meltrate function is identical for both models. For the burned scenario, meltrates were increased by the same amount as the multi-basin model. The percentile SWE shift throughout the season, resulting from increasing the meltrate, can be seen by comparing the gray lines (original meltrates) to the colored lines (increased meltrates).

The peak annual runoff from most subbasins tended to increase as the meltrate increased. However, some subbasins tended to reduce peak runoff. All subbasins had years with both reduced and increased peak runoff, as illustrated in Figure 9. This variability can be attributed to the shift in snowmelt timing. Two pathways for increased peak annual flow were observed: 1) the snow melted faster, thus producing higher flows (Figure 10) and 2) an earlier snowmelt event was now able to produce a higher peak flow (Figure 11). These earlier events either had more snow available for melting than the later event or had weather conditions more conducive for rapid melt. Reductions in peak flow, on the other hand, were generally a result of snowpack being depleted at an earlier ATI, which limited the available SWE for later events (Figure 12). In this case, the weather conditions of the earlier events were less conducive for rapid melt than the later event, and the peak of the later event was reduced due to limited available SWE. These changes are less noticeable when looking at the outflow from the entire larger watershed because for any given year some subbasins have increases in flow while others decrease. Post-wildfire snowmelt studies previously discussed also showed both increases and decreases in peak flow following wildfires, with increases in peak flow being more common.

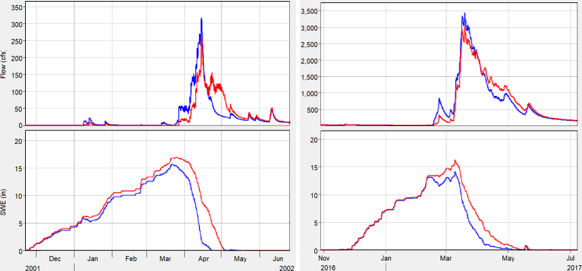
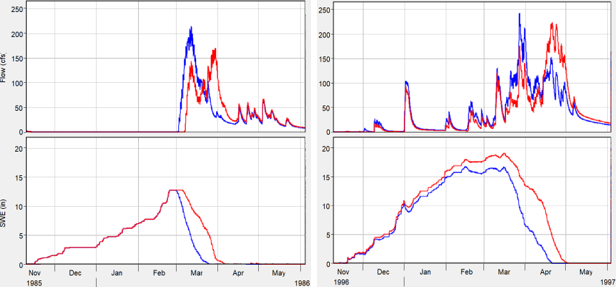
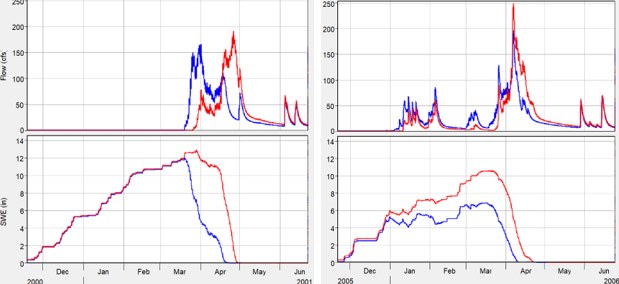
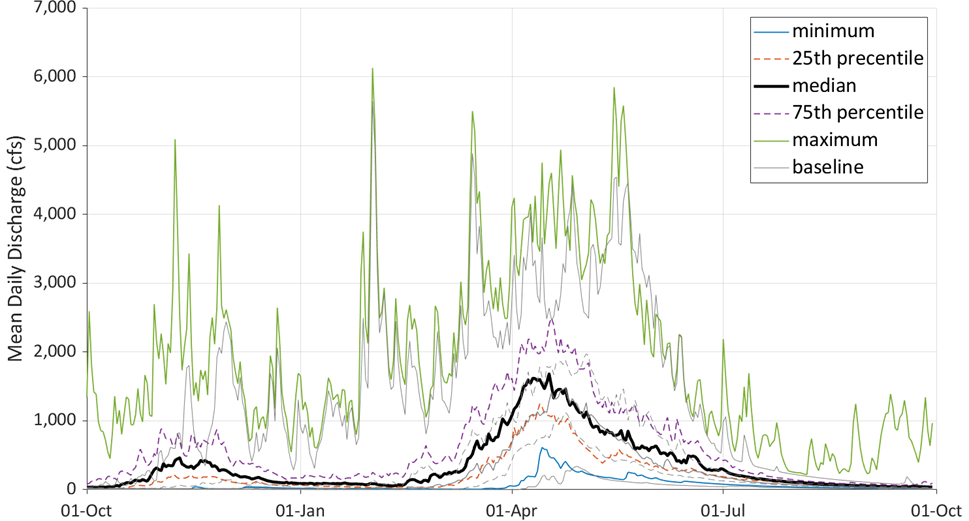
Watershed runoff shifts to earlier in the season when meltrates are increased. This shift is illustrated in the summary hydrograph in Figure 13, which was generated from the multi-basin Lolo watershed model. Note that summary hydrographs are not a representation of hydrograph shapes, but rather daily statistical flows for each day of the year which demonstrate seasonality.

Coldrate Coefficient
Justification: The Coldrate Coefficient represents the influence of air temperature on the internal temperature of the snowpack. Higher values result in the snow temperature more closely tracking the observed air temperature and a low value will result in a slow cooling or warming of the snow (EM-1110-2-1406). Increased wind after a wildfire (due to loss of canopy) would accelerate the influence of air temperature on the snow, so it would make sense to increase this parameter post wildfire.
Considerations: Areas with dense trees would be impacted more than areas with sparse tree cover and the coefficient may decrease with snow depth.
Range: This coefficient should be increased post wildfire. Valid coefficient range: 0 to 0.99.
HEC-HMS Hypothetical Scenario: Coldrate Coefficient
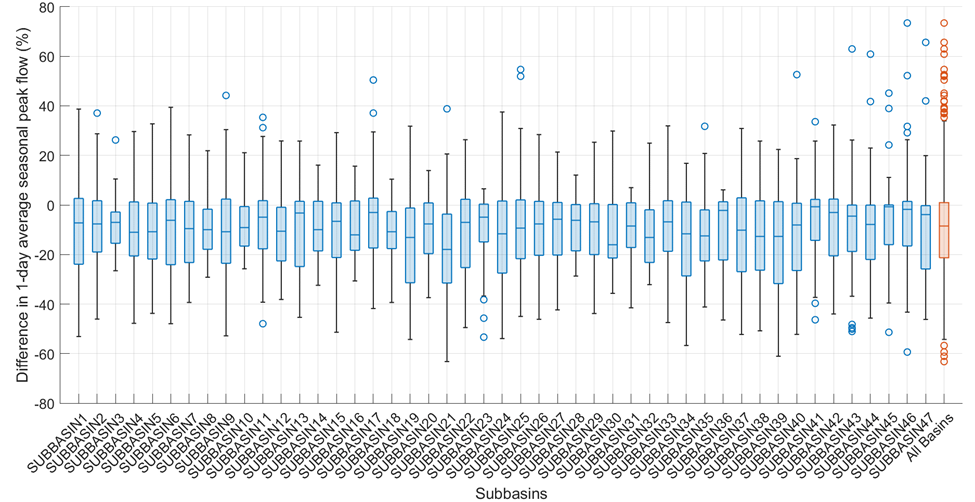
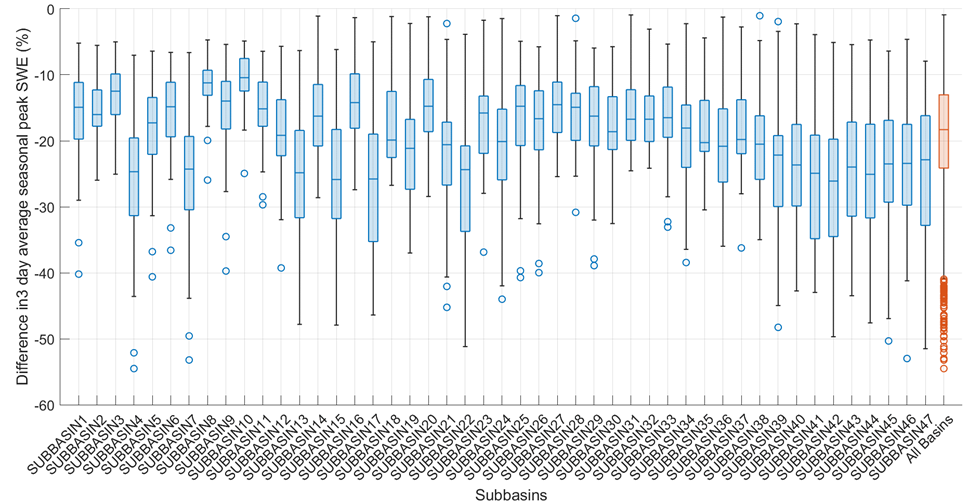
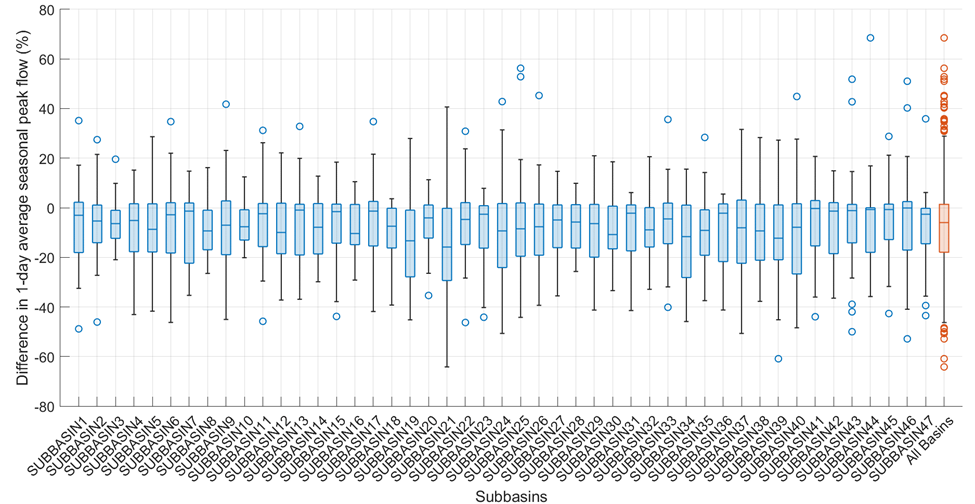
For this scenario, the coldrate coefficient was increased from 0.35 to its maximum value of 0.99. Figure 14 shows the change in the peak seasonal SWE resulting from increasing the coldrate. The peak SWE is reduced for every basin and every water year, with a median reduction of 25% (average 27%), as illustrated by the red boxplot. Figure 15 shows melt-out dates shifting earlier in the season, with a median shift of 6 days (average 7 days). The shift was smaller than the melt-out date shift that resulted from increasing meltrates, even though the peak SWE was impacted more by the coldrate coefficient. If a smaller increase in the coldrate coefficient had been assumed (i.e., to match the peak SWE shift of the meltrate scenario), the difference in melt-out date would be even more pronounced, demonstrating that the melt-out date is less sensitive to the coldrate coefficient than it is to meltrate. These conclusions are supported by comparing Figure 8 to Figure 16, which shows larger, more uniform reductions in SWE throughout the season when the coldrate coefficient is increased, while the impact on melt-out date is less pronounced. Figure 17 shows that the peak flow tends to decrease when the coldrate coefficient is increased, although increases in peak flow are also possible. Figure 18 shows an increase in early season snowmelt runoff, resulting in less runoff volume available during the peak season.


ATI-Coldrate Function
Justification: The Cold Content is the amount of energy (in terms of the amount of ice the energy would melt) required for a snow cover to reach 32 ∘F for its entire depth. Increasing the coldrate increases cold content, while decreasing the coldrate decreases cold content. Cold Content is a function of ATICC and the Coldrate, which together make up the ATI-Coldrate Function. If more energy is added to the snowpack from solar radiation (partially due to less canopy cover and partially due to decreased albedo), then the coldrate could be reduced to account for this (solar radiation is not explicitly quantified in the temperature index method, so the required energy is reduced to achieve the same effect). If, on the other hand, the post wildfire reduction in longwave radiation exceeds the increase in absorbed solar radiation, the coldrate should be increased. The coldrate determines the rate at which cold content is accumulated, so by reducing the coldrate, the amount of energy needed to initiate snowmelt is also reduced. The cold content determines the frequency and duration of melting periods. Therefore, the accumulation period can be shortened (i.e., the peak SWE date is shifted earlier in the season) by reducing the coldrate. However, this will also reduce the peak SWE.
Considerations: Since this parameter is being changed as a proxy for changes in net radiation, consider changing the parameter by different amounts throughout the season to account for seasonal changes in solar radiation.
Range: 0.01 to 0.03 inches/°F/day is the normal range for this parameter. The coldrate is reduced as a proxy for increasing radiation. Since this parameter is being changed as a proxy for changes in net radiation, values outside of this range might be acceptable in some locations.
HEC-HMS Hypothetical Scenario: Coldrate
For this scenario, the Coldrate in the ATI-Coldrate Function was reduced from 0.02 to 0.01. The effects of reducing the coldrate are similar to the outcome of increasing the coldrate coefficient. When comparing the coldrate coefficient figures above to the coldrate figures below (Figure 19 to Figure 23), the differences in magnitude are primarily a function of parameter value selection; the coldrate coefficient increase was a more aggressive parameter change. Some events are likely more susceptible to changes in one of the parameters, but this is difficult to decern from these results.


Base Temperature
Justification: The temperature index is the difference between the air temperature and the base temperature. The base temperature determines what temperature results in an index of zero. Snow cannot melt when the index is below zero. The cold content is also tied to the temperature index. So, the base temperature is the threshold above which energy in the snowpack grows. The growing energy either contributes to overcoming the cold content or melting the snow. Increased solar radiation (from lack of canopy cover after a wildfire) and decreased albedo could result in snow melting at a lower temperature. This may justify changing the base temperature after a wildfire.
Considerations: The base temperature is a constant that does not vary with season, making it a less flexible parameter than the coldrate and meltrate, which can both be tied to an ATI function. In addition, the base temperature is not physically tied to melting processes and it affects multiple parameters, making it more difficult to determine reasonable adjustments. For these reasons, the base temperature may not be the first choice when selecting post-wildfire adjustment parameters. However, it can be a simple parameter to use for global adjustments. When calibrating a model to a burned watershed (rather than adjusting a previously calibrated unburned model) it makes sense to use the base temperature more liberally as a calibration parameter since less physical justification is required.
Range: For unburned watersheds, the base temperature is usually set near 32 deg °F, if the timeseries is sub-daily. Since we would not expect this parameter to be the dominant post-wildfire calibration parameter, it makes sense not to vary this parameter by so much that it influences snowmelt more than the other parameters considered. This seems to be on the order of about 1 degree reduction in base temperature.
HEC-HMS Hypothetical Scenario: Base Temperature
A scenario was modeled in which the base temperature was reduced from 32 °F to 31 °F. This had a similar effect on SWE (Figure 24 to Figure 26) as changing the parameters discussed above, with the accumulation season most closely resembling the meltrate scenario but the melting season was more similar to the coldrate coefficient and coldrate function scenarios. The change in peak flow (Figure 27 and Figure 28) was less pronounced than the other scenarios evaluated. Note that the shift in melt-out date for 2018 in Figure 25 is less meaningful due to dual peak SWE in some subbasins (see discussion regarding Figure 7).


Other Parameters
This section discusses additional parameters that influence snowpack and runoff but are either difficult to parameterize, have a more substantial impact on the rainfall runoff season than the snowmelt season, or are not among the primary parameters varied for a post-wildfire scenario.
Canopy Evaporation and Transpiration
Precipitation intercepted by and stored on the surface of plant leaves evaporates. Plants also consume ground water which is lost to the atmosphere via transpiration. These losses are accounted for in HEC-HMS if a canopy method is selected. Plant life can be reduced substantially after a wildfire. As a result, the canopy evaporation and transpiration should be reduced when modeling burned watersheds (until vegetation recovers). Depending on the type of trees and other plants, ground water uptake losses may be smaller during the snowmelt season if the growing season is later in the year.
HEC-HMS Hypothetical Scenario: Canopy Evapotranspiration
The Simple Canopy method, along with the simple uptake method, were used for the Lolo Creek watershed. In this method, the total combined evaporation and transpiration are computed as a potential evapotranspiration. Then a factor called the Crop Coefficient is applied to the potential evapotranspiration to get the actual evapotranspiration. For this watershed, the potential evapotranspiration was estimated using the Hamon Method. The evapotranspiration is taken from the canopy storage until it is depleted and then it is taken from the soil if water is available in the soil. Setting the canopy Max Storage to zero (e.g. for a severely burned forest with no interception) would not change the total evapotranspiration, unless there were no moisture in the soil; it just changes the source of the evapotranspiration (soil instead of canopy). However, changing the crop coefficient would change the total evapotranspiration.
For this scenario, a severely burned forest was assumed, so the canopy Max Storage was set to zero. The Crop Coefficient was reduced from 1 to 0.35. This coefficient was arrived at by first selecting a conservatively low bare soil crop coefficient of 0.15. This crop coefficient was taken as representing a hypothetical worst-case scenario where all the vegetation had burned, however, no data were available to confirm if this is a representative post-fire severe burn crop coefficient. Then the original crop coefficient of 1 was evaluated and determined to be overly high for this watershed. A crop coefficient of 0.8 seemed more appropriate, implying that the residual of 0.2 was accounting for other processes. As a result, the bare soil crop coefficient of 0.15 was added to 0.2 to get 0.35.
While the effects of evapotranspiration on SWE were not as pronounced as the effects of the other parameters previously discussed, they were still noteworthy. The added volume of water that would have been lost to the atmosphere increased the overall SWE peak depth by a median of 3.7% (Figure 29). This had only a very slight impact on the melt-out date, shifting it forward by a mean of 0.5 days, with a median shift of zero.

The reduced evapotranspiration had a significant impact on the runoff. As shown in Figure 30, a secondary peak runoff season developed in the late fall and early winter from rainfall runoff. Since this study focuses on snowmelt and rain-on-snow runoff, the rainfall runoff season of the model was not as well calibrated, and additional factors influencing rainfall runoff following a wildfire were not captured. As a result, the changes during that season may not be well represented. Nonetheless, clear impacts to the rainfall runoff season are exhibited.
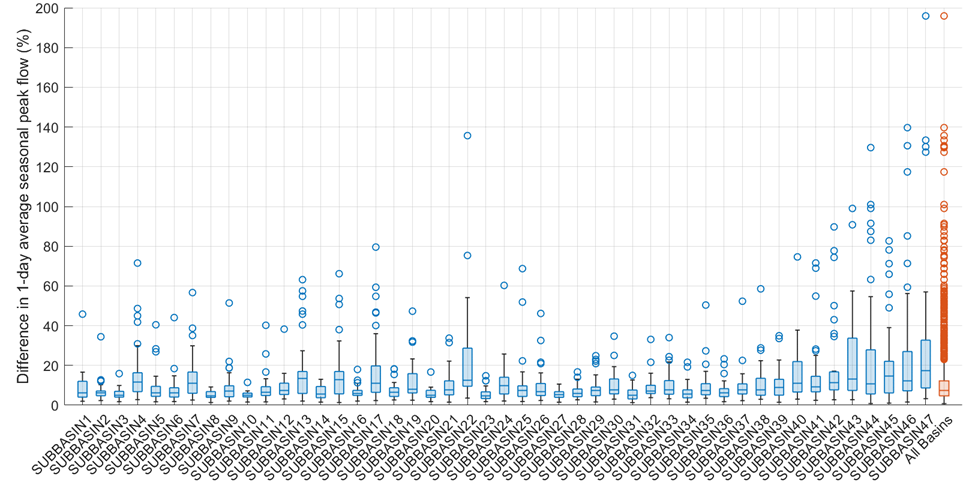
Notable impacts to the peak flow also occurred during the spring runoff season, illustrated in Figure 31. A simplistic evapotranspiration method was employed, as previously noted. Seasonal variation in the crop coefficient was not modeled and there was some uncertainty in selecting the magnitude of the change in the coefficient, however, for this hypothetical scenario the accuracy was sufficient to demonstrate a notable trend in increased runoff. The peak flows in Figure 31 were restricted to January 15th to June 30th to highlight the changes in peak flow during the snowmelt season. The percent change in peak flows prior to January 15th, in the fall and early winter, were more substantial than they were during the snowmelt season, as previously illustrated in Figure 30; although, large peak flows occur more frequently during the snowmelt season. It should be noted that two outlier points were omitted from subbasin 47 in Figure 31 that had unremarkable flow rates (post-fire flows less than the median) but the percent increase was about 500% due to the baseline flow being small; these points made the figure difficult to read due to a large y-axis scale.

Canopy Sublimation
HEC-HMS does not model canopy sublimation with the Temperature Index Method. In low-humidity windy environments, sublimation has a larger effect on the SWE volume. This loss in volume is neglected in the Temperature Index Method. Since canopy sublimation occurs during the accumulation season, if the model were calibrated to match SWE, seasonal parameter(s) would have been calibrated to compensate for this loss. It's possible that the coldrate could have been calibrated a little low and meltrate ATI functions could have been calibrated a little high during the accumulation season to maintain SWE. The reverse could be done during post-wildfire calibration because there will be less sublimation during the accumulation season since there is less snow in the canopy. However, sublimation may increase during the melt season at the ground-level after a wildfire, partially offsetting the volume gain.
If the meltrate is increased for post-wildfire scenarios, it could be increased by a smaller amount during the accumulation portion of the season. Similarly, if the coldrate is reduced, it could be reduced by a smaller amount during the accumulation period. While this does not change the overall runoff volume during a given season (and hence does not fully correct the discrepancy), it can help to maintain a more correct SWE depth, which translates to more late season volume.
Infiltration
Infiltration rates will likely change after a wildfire. Although infiltration rates can make a notable difference during intense rainfall, snowmelt rates are much smaller than rainfall rates, making infiltration less important. If the ground is frozen, infiltration rates will not influence snowmelt runoff. If the ground is not frozen, it could be saturated during much of the snowmelt season. No studies have been found that quantify snowmelt infiltration rates after a wildfire. While reduced infiltration could influence runoff in severely burned forests, without data it is difficult to quantify these impacts.
Px Temperature
Wildfires are not expected to have significant impacts on the threshold temperature, Px, at which precipitation falls as snow. It is possible that temperatures at the ground surface, or measurements of those temperatures, could be influenced by a burned watershed, resulting in a need to recalibrate Px. But changes in the actual Px temperature would likely be small. Furthermore, Giovando et. al. (2024) showed that both the direction and magnitude of post-wildfire changes in Px were highly variable between sites. Therefore, when the physical justification for modifying other parameters is stronger than the justification for modifying the Px temperature, modifying the other parameters is preferred. Although, when attempting to calibrate modeled SWE accumulation to post-wildfire measurements of SWE accumulation, there may be instances in which changing Px Temperature is justified. The Px temperature was reduced by 1 degree for this scenario which resulted in the median peak SWE being reduced by 9.6% and the median peak flow reduced by 1.5%. There also tended to be more runoff during the snowpack accumulation season and less during the melt season. The results of that analysis are not presented here because it would be difficult to provide guidance for a parameter that lacks both a clear physically-based rational for changing and definitive field-justified conclusions.
Conclusions and Implications for Combining Scenarios
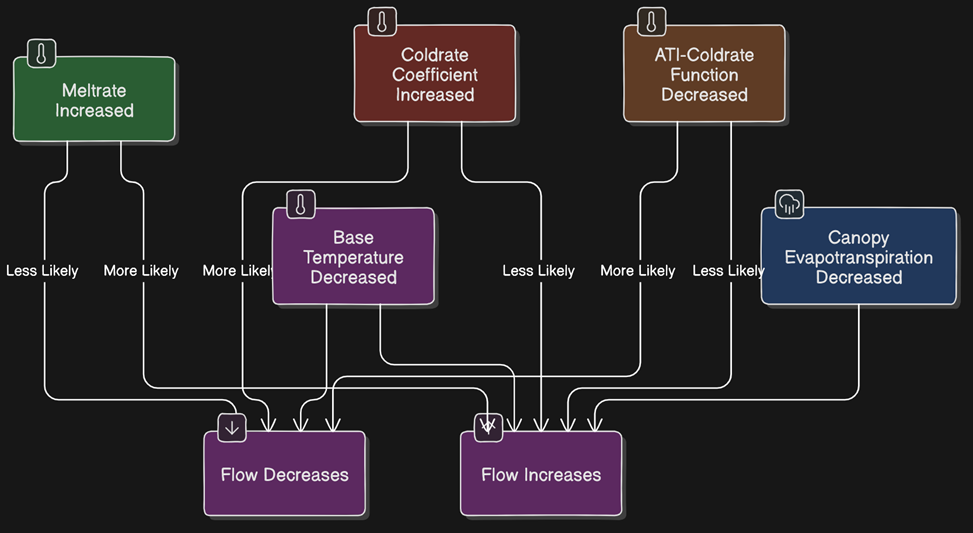
Figure 32 below is a representative example of how the various parameters considered influence SWE and discharge. Each of these parameters were changed by notable significant amounts in the hypothetical scenarios previously discussed to simulate the effects of the watershed being burned. Only one parameter was changed at a time for each scenario. Figure 33 shows all the data points for each scenario. Changes to each of these parameters had variable effects on SWE and discharge, which were a function of subbasin and meteorological year, but tended to reduce peak SWE; the exception was reducing canopy evapotranspiration, which increased peak SWE. The flowchart in Figure 34 summarizes the effects on peak SWE.
Post-wildfire increases in meltrates tended to increase the peak annual runoff, while either increasing the coldrate coefficient or decreasing the coldrate in the coldrate function tended to reduce peak annual flow. Changes in the base temperature also affected the peak flow but the median change in peak flow was near zero. Decreasing the canopy evapotranspiration (crop coefficient) increased peak runoff and produced a secondary runoff season in late fall and early winter from rainfall runoff. Meltrate affected the melt season more than any of the other parameters. Figure 32 shows an example of the relative impacts of varying individual parameters. The sections following explore the effects of varying multiple parameters at the same time.


Post-wildfire increases in meltrates tended to increase the peak annual runoff, while either increasing the coldrate coefficient or decreasing the coldrate in the coldrate function tended to reduce peak annual flow. Changes in the base temperature also affected the peak flow but the median change in peak flow was near zero. Decreasing the canopy evapotranspiration (crop coefficient) increased peak runoff and produced a secondary runoff season in late fall and early winter from rainfall runoff. Meltrate affected the melt season more than any of the other parameters. Figure 32 shows an example of the relative impacts of varying individual parameters, and Figure 35 summarizes the general trends. The sections following explore the effects of varying multiple parameters at the same time.
Worst-Case Runoff Scenario
This scenario aims to create a worst-case runoff scenario. To achieve this, only the previously analyzed parameters that increased runoff are changed, namely meltrate and canopy evapotranspiration (crop coefficient and maximum canopy storage). To further amplify the peak runoff, the meltrate was not increased throughout the entire accumulation season because this would have reduced the total SWE which reduces available snowpack for melting later in the season, hence reducing runoff. Keeping the meltrate fixed at pre-fire values during the early accumulation season while increasing the meltrate later in the season can be justified to some extent by recognizing that it is possible for a watershed not to experience a reduction in peak SWE after it has been burned. Although, when this occurs it is commonly attributed to reduced sublimation rather than melting rates, but melting rates could play a role.
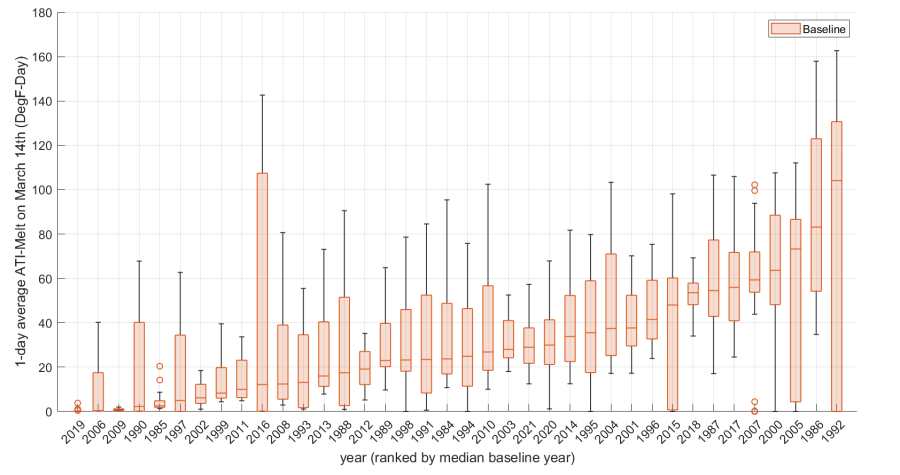
The snowpack accumulation season effectively ends at the peak SWE date. The peak SWE date was computed across all years and all subbasins for the baseline scenario. The median peak SWE date was March 14th, and the mean peak SWE date was March 12th. The median ATIMR on March 14th across all subbasins and all years was 28 Fahrenheit Degree-Days; the mean was 75 Fahrenheit Degree-Days. ATIMR varies considerably from year to year, with some years having notably more variation between subbasins, as illustrated in Figure 36. For the worst-case post-wildfire scenario, the meltrate was not changed for ATIMR between zero to 20 because this is usually before the peak SWE date. Then the meltrate was gradually increased while ATIMR was between 20 and 50; the meltrate was doubled for all other ATIMR (see Figure 37).

Since a severely burned forest was assumed, the canopy Max Storage was set to zero and the Crop Coefficient was reduced from 1 to 0.35. As previously explained, this assumes there is no canopy and therefore no canopy storage, and plant uptake is minimal.
It seems likely that eliminating the canopy would result in increased wind and therefore an increase in the coldrate coefficient; however, since the intent was to produce an upper bound worst-case scenario, the coldrate coefficient was not changed. A reduction in the coldrate in the ATI-Coldrate Function might also have been justified but was similarly neglected; there may be some overlap in the function of the meltrate and coldrate, which provides some justification.
Infiltration rates were not changed in this scenario because the soil in this basin has a high capacity for infiltration, making it difficult to calibrate direct runoff (e.g. the constant rate parameter) given that the flow is nearly entirely subsurface. In addition, as previously discussed, studies have not been conducted to determine how much the infiltration rate is affected in snowmelt basins.
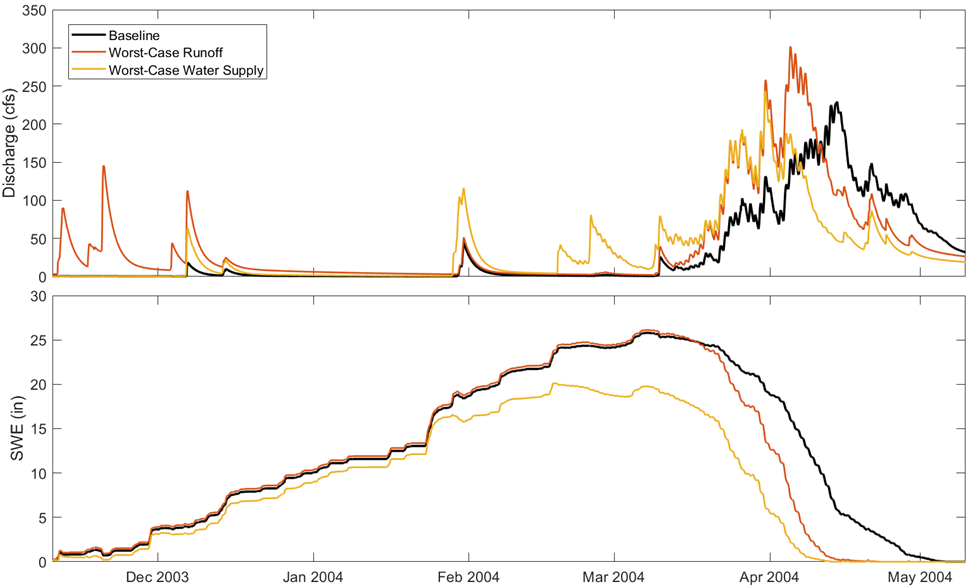
As expected, increases in peak SWE for this scenario tended to be similar in magnitude to the canopy scenario but there was more variability, with more subbasins also experiencing notable decreases in peak SWE during some years (Figure 38). The median increase in peak annual spring runoff is 22% (Figure 39). The spring season was defined as January 15th through June to be consistent with the canopy scenario; note that the melt season begins (i.e. the peak SWE date) after January 20th for 95% of the subbasins in the worst-case runoff scenario. Two outliers were removed from the plot to reduce the y-axis extents. These outliers had changes in peak flow near 500% but the magnitude of the post-fire peaks was less than the median peak, making them unremarkable. The combined basin increase in peak runoff and seasonal shift in runoff timing can be seen in Figure 40.


Worst-Case Water Supply Scenario
The purpose of this scenario was to reduce snowpack accumulation as much as possible to simulate a scenario in which snow storage is severely reduced following a wildfire. Since the previous scenarios for melt rate, coldrate coefficient, and ATI-coldrate function all resulted in reduced peak SWE, all these parameters were set to the same values as their standalone scenarios.
Base temperature was not adjusted because of difficulty in determining a reasonable magnitude for the adjustment in this multi-parameter scenario, given that it overlaps in function with other parameters.
Canopy evapotranspiration was not altered from the baseline scenario because it increases SWE. This can be at least partially justified by either assuming a scenario with less severe burning, or a scenario in which the vegetation recovered enough prior to the snowmelt season to resemble pre-fire plant uptake.
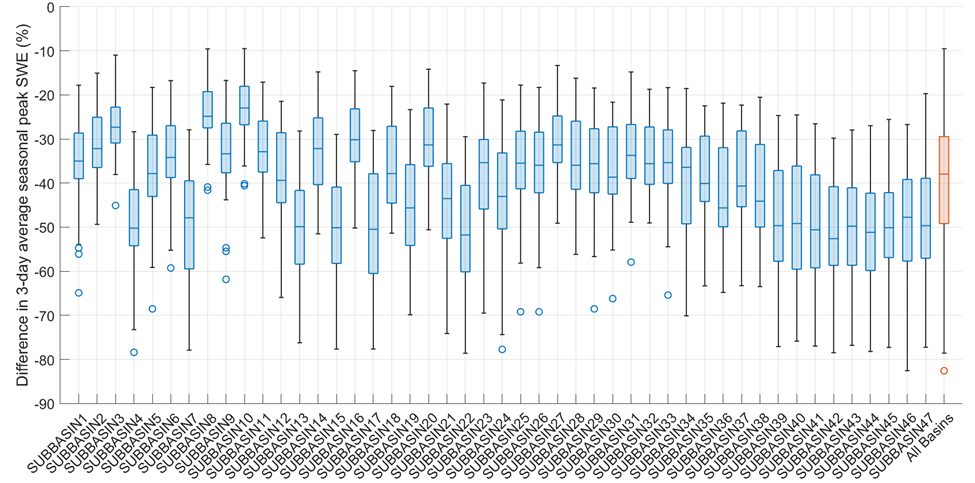
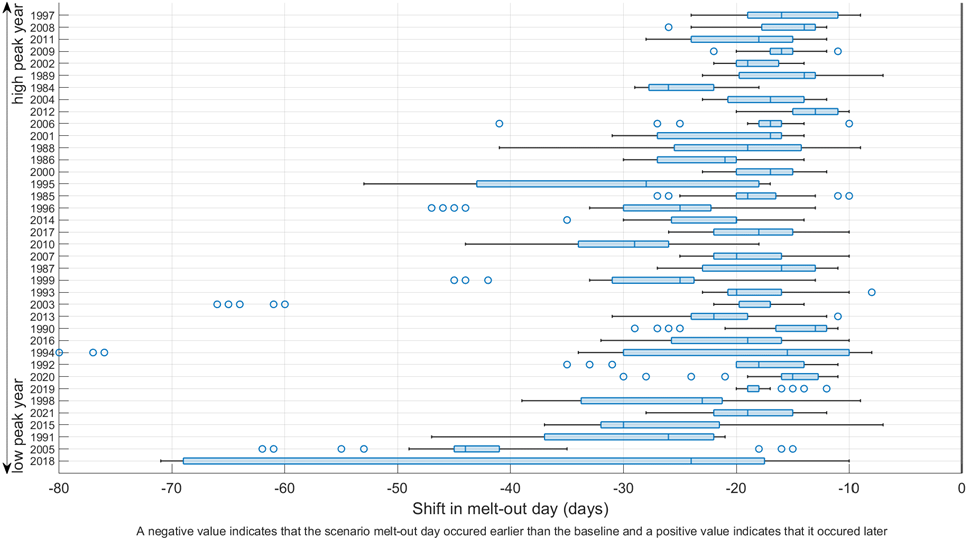
This scenario resulted in a median reduction in peak SWE of 38% (Figure 41). The effect on the melt-out date is shown in Figure 42. The combined effect at the basin outlet was a smaller earlier peak runoff season, as shown in Figure 43.

Comparison of Worst-Case Runoff and Water Supply Scenarios
The worst-case runoff scenario and the worst-case water supply scenario together demonstrate the potential range of wildfire impacts that the temperature index method is capable of simulating. The boxplots for these scenarios illustrated the variability between water years and the variability between watersheds (subbasins). The variability explains to some degree the variability observed in snowmelt literature. The shift in timing and peaks are more easily observed by looking again at the 2004 example (Figure 44). Although, the water supply scenario increase in peak flow for this subbasin/year combination is not representative of most years – typically the peak flow is reduced for the water supply scenario. The summary hydrographs in Figure 40 and Figure 43 show that an earlier peak runoff date (and hence melt-out date) is common in both scenarios, which is consistent with literature previously cited.
References
Anderson, E. (2006). Snow Accumulation and Ablation Model – SNOW-17.
Burles, K., & Boon, S. (2011). Snowmelt Energy Balance in a Burned Forest Plot, Crowsnest Pass, Alberta, Canada. Hydrological Processes, 25, 3012–3029. doi:10.1002/hyp.8067
Eraser. (2024). Image generated from text prompt using DiagramGPT (leverages OpenAI's GPT-4) [large language model]. Retrieved September 8, 2024, from https://www.eraser.io/diagramgpt
Giovando, J., & Niemann, J. D. (2022). Wildfire Impacts on Snowpack Phenology in a Changing Climate within the Western U.S. Water Resources Research, 58(8). doi:10.1029/2021WR031569
Giovando, J., Niemann, J. D., & Fassnacht, S. R. (2024). Wildfire Impacts for Temperature Index Snowpack Model Parameters. Hydrologic Processes, 38(11). doi:10.1002/hyp.15334
Goeking, S. A., & Tarboton, D. G. (2020). Forests and Water Yield: A Synthesis of Disturbance Effects on Streamflow and Snowpack in Western Coniferous Forests. Journal of Forestry, 118, 172–92. doi:10.1093/jofore/fvz069
Kean, J. W., & Staley, D. M. (2021). Forecasting the Frequency and Magnitude of Postfire Debris Flows across Southern California. Earth’s Future, 9(3). doi:10.1029/2020EF001735
Kilgore, R., Atayee, A. T., Curtis, D., Harris, J., Herrmann, G. "., & Thompson, D. (2023). Highway Hydrology: Evolving Methods, Tools, and Data. Chapter 7, Section 7.1. Washington, D.C.: Hydraulic Engineering Circular No. 19 (HEC-19). Publication No. FHWA-HIF-23-050. Federal Highway Administration.
Liu, W., & He, S. (2023). An Integrated Model for Simulating Melt-Driven Debris Flow in a Snow-Dominated Catchment. Landslides, 21(3), 499–516. doi:10.1007/s10346-023-02174-9
Maxwell, J. D., Call, A., & St. Clair, S. B. (2019). Wildfire and topography impacts on snow accumulation and retention in montane forests. Forest Ecology and Management, 432, 256-263. doi:10.1016/j.foreco.2018.09.021
McGrath, D., Zeller, L., Bonnell, R., Reis, W., Kampf, S., Williams, K., . . . Rittger, K. (2023). Declines in Peak Snow Water Equivalent and Elevated Snowmelt Rates Following the 2020 Cameron Peak Wildfire in Northern Colorado. Geophysical Research Letters, 50(6). doi:10.1029/2022gl101294
Moeser, C. D., Broxton, P. D., Harpold, A., & Robertson, A. (2020). Estimating the Effects of Forest Structure Changes from Wildfire on Snow Water Resources under Varying Meteorological Conditions. Water Resources Research. doi:10.1029/2020wr027071
Molotch, N. P., Blanken, P. D., Will, M. W., Turnipseed, A. A., Monson, R. K., & Margulis, S. A. (2007). Estimating sublimation of intercepted and sub-canopy snow using eddy covariance systems. Hydrological Process, 21, 1567–1575. doi:10.1002/hyp.6719
Mostbauer, K., Kaitna, R., Prenner, D., & Hrachowitz, M. (2018). The Temporally Varying Roles of Rainfall, Snowmelt and Soil Moisture for Debris Flow Initiation in a Snow-Dominated System. Hydrology and Earth System Sciences, 22(6), 3493–3513. doi:10.5194/hess-22-3493-2018
Neary, Daniel G.; Ryan, Kevin C.; DeBano, Leonard F. eds. (2005). (revised 2008) Wildland fire in ecosystems: effects of fire on soils and water. Gen. Tech. Rep. RMRS-GTR-42-vol.4. Ogden: U.S. Department of Agriculture, Forest Service, Rocky Mountain Research Station.
Parsons, A., Robichaud, P. R., Lewi, S. A., Napper, C., & Clark, J. T. (2010). Field Guide for Mapping Post-Fire Soil Burn Severity. Gen. Tech. Rep. RMRS-GTR-243. Fort Collins: U.S. Department of Agriculture, Forest Service, Rocky Mountain Research Station.
Sexstone, G. A., Clow, D. W., Fassnacht, S. R., Liston, G. E., Hiemstra, C. A., Knowles, J. F., & Penn, C. A. (2018). Snow Sublimation in Mountain Environments and Its Sensitivity to Forest Disturbance and Climate Warming. Water Resources, 54, 1191–1211. doi:10.1002/2017WR021172
Singh, P., Spitzbart, G., Hübl, H., & Weinmeister, H. (1997). Hydrological Response of Snowpack under Rain-On-Snow Events: A Field Study. Journal of Hydrology, 202, 1-20. doi:10.1016/s0022-1694(97)00004-8
Smoot, E. E., & Gleason, K. E. (2021). Forest Fires Reduce Snow-Water Storage and Advance the Timing of Snowmelt across the Western U.S. Water, 13, 3533. doi:10.3390/w13243533
Staley, D. M., Negri, J. A., Kean, J. W., Laber, J. L., Tillery, A. C., & Youberg, A. M. (2016). Updated Logistic Regression Equations for the Calculation of Post-Fire Debris-Flow Likelihood in the Western United States. Reston: U.S. Geological Survey Open-File Report 2016–1106. doi:10.3133/ofr20161106
Staley, D. M., Negri, J. A., Kean, J. W., Laber, J. L., Tillery, A. C., & Youberg, A. M. (2017). Prediction of Spatially Explicit Rainfall Intensity–Duration Thresholds for Post-Fire Debris-Flow Generation in the Western United States. Geomorphology, 278, 149–62. doi:10.1016/j.geomorph.2016.10.019
USACE (U.S. Army Corps of Engineers). (1956). Summary Report of the Snow Investigations - Snow Hydrology. Portland: North Pacific Division Corps of Engineers, U.S. Army.
USACE (U.S. Army Corps of Engineers). (1998). Engineering and Design: Runoff From Snowmelt. EM-1110-2-1406. Washington, DC: Department of the Army U.S. Army Corps of Engineers.
USACE (U.S. Army Corps of Engineers). (2024, September). HEC-HMS Technical Reference Manual. Hydrologic Engineering Center, Davis, CA. Retrieved from https://www.hec.usace.army.mil/confluence/hmsdocs/hmstrm
Wagenbrenner, J. W. (2013). Post-fire stream channel processes: Changes in runoff rates, sediment delivery across spatial scales, and mitigation effectiveness. Doctoral dissertation, Washington State University. Retrieved from https://www.proquest.com/dissertations-theses/post-fire-stream-channel-processes-changes-runoff/docview/1459240156/se-2
Wu, Z., & Fang, H. (2024). Snowmelt erosion: A review. Earth-Science Reviews. doi:10.1016/j.earscirev.2024.104704
Young-Robertson, J. M., Bolton, W. R., Bhatt, U. S., Cristóbal, J., & Thoman, R. (2016). Deciduous Trees Are a Large and Overlooked Sink for Snowmelt Water in the Boreal Forest. Scientific Reports, 6(1). doi:10.1038/srep29504