Viewing Ensemble Reports
ResSim's standard reports have been updated to recognize when they are provided an ensemble alternative, but they will only show results for a single ensemble member at a time. By default, the report will open showing the results for the first computed member of the ensemble. You can change which member is displayed by selecting Set Collection Run from the Options menu of the report, then choosing the desired member's ID number from the Collection Run Options dialog ("Figure: Reservoir Summary Report - Set Collection Run").
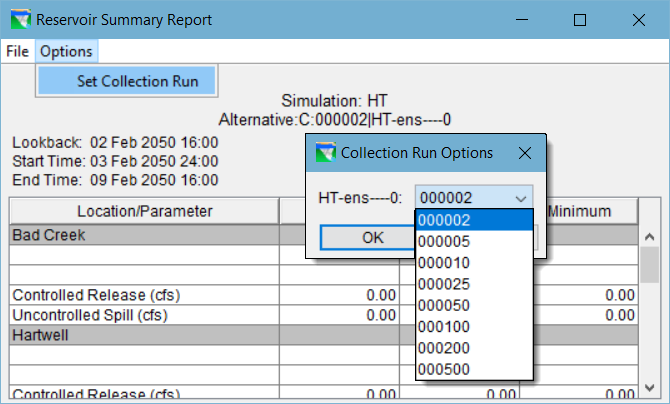
HEC-ResSim will remember the selection when you view other reports.
Plotting Ensemble Results
The standard ResSim (and user) plots that you can produce from the context menu of an element in the active schematic have been enhanced to recognize when they are sent an ensemble alternative’s results. Unlike the standard reports, ResSim plots will show all the computed ensemble members’ results at the same time.
Since there can be many computed members in an ensemble alternative, viewing a rainbow of curves is usually not conducive to understanding the overall results. So, in an effort facilitate results analysis, a new plotting paradigm was created: for each plotted parameter, all members of the ensemble (traces) are drawn in the same color with a slightly thinner line and with a moderately-high level of transparency. When several traces all plot on top of each other, the density of color increases and you can see where the results overlap. To also aid in analysis, five additional curves are added for each plotted parameter to reflect the minimum, maximum, median, and 25% and 75% probabilities computed across the computed members of the ensemble for each timestep. These additional curves are drawn with a thicker line weight and zero transparency.
To plot ensemble results:
- Select an ensemble alternative by placing a checkmark in the box beside it in the Simulation Control panel of an active simulation. Although ResSim will plot multiple alternatives at the same time, select only one alternative at a time until you get used to viewing the ensemble results.
- Right-click on an element in the schematic that you want to view results for then select the predefined (or user) Plot you wish to view.

Figure: Ensemble Plot for a Reservoir |
An example of a standard reservoir plot is shown in Figure G.25. Although the text in legend in the illustration is quite tiny, it can be noted that there are far fewer entries in the legend than there are curves drawn on in the plot. This is because the legend identifies the results by parameter and collection, not by individual member. In addition, the curves for the computed statistics are not listed since they are considered members of each collection, not separate datasets.
The same plot editing features are available for an ensemble alternative plot that are available for a standard plot. However, the implementation of the new plotting paradigm used for ensembles is not as complete as you might expect, so some of the plot editing features may not function correctly on an ensemble plot. This will be improved in a future release of ResSim.
This warning was available at the time of the ResSim 3.3 release, and while the plotting may have improved since then, it is still not fail-proof.
RSS-169
-
Getting issue details...
STATUS