Download PDF
Download page Drainage Area Ratio vs MOVE.3 Record Extension.
Drainage Area Ratio vs MOVE.3 Record Extension
This guide shows the difference in predicted annual peak flows from using a simple drainage area ratio versus a MOVE.3 Record Extension.
One of the simplest forms of record extension is to take a nearby gage and apply a drainage area ratio. Under this approach, the peak flow at the site of interest is estimated by applying a ratio to the known peak flow at a nearby site using the following equation:
Y=X\left(\frac{A_{y}}{A_{x}}\right)^{\phi}
where Y is streamflow at ungaged location, X is streamflow at the gaging station, Ay is drainage area for ungaged site, Ax is drainage area for gaged site, and ϕ is a bias correction (typically 1 for most areas).
A drainage area ratio is most appropriate when the difference in drainage area between the two sites is small and the sites are located on the same river. There is no firm standard as for what relative difference in drainage areas is too high to apply the method. A commonly used rule of thumb is not to use the drainage area ratio approach when the watershed areas are more than 50% different. The drainage area ratio approach effectively assumes that precipitation and basin characteristics are the same between both watersheds. A drainage area ratio may be the only option if there are no other nearby gages.
It is tempting to use the drainage area ratio approach liberally due to its simplicity. However, in most cases, there is gage data available at multiple locations for at least a short period of time. Even if there is only a short period of overlapping record, record extension approaches with MOVE.3 (or even simple ordinary linear regression) will generally produce more accurate predictions.
Example 1: When Drainage Area Ratio works well
The drainage area ratio often works well when the two sites are on the same river, with drainage areas within 50% of each other.
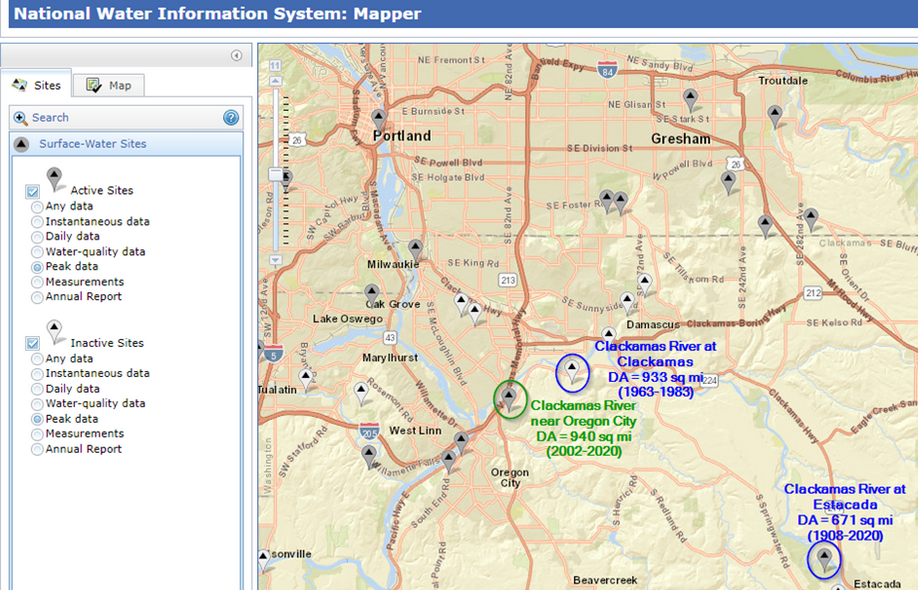
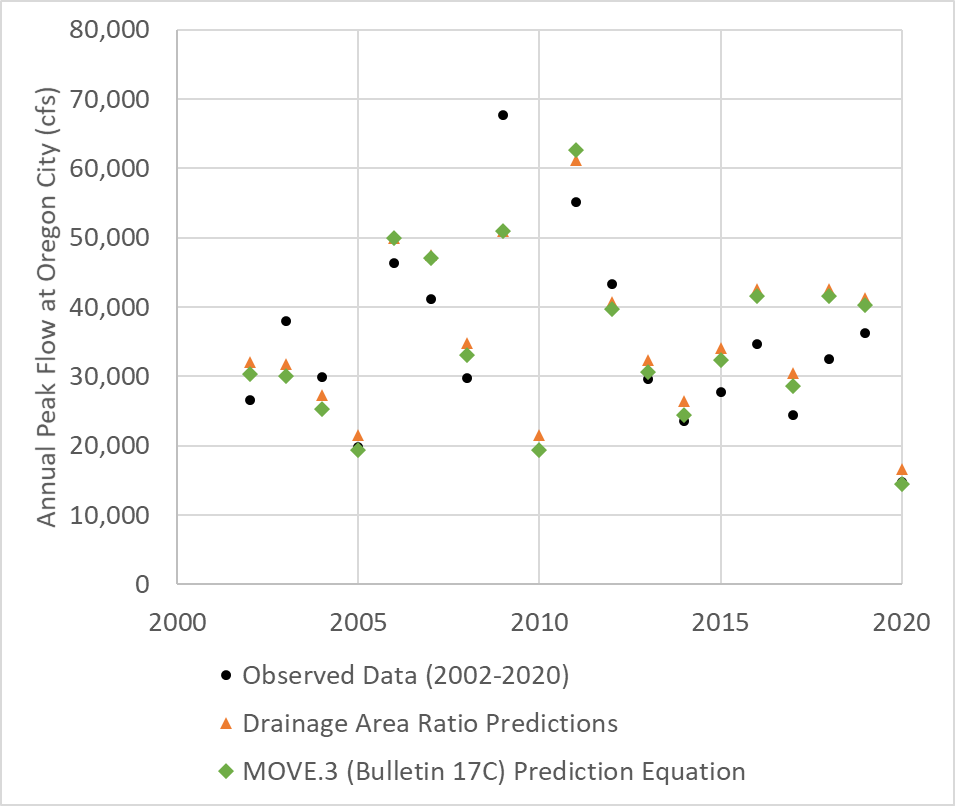
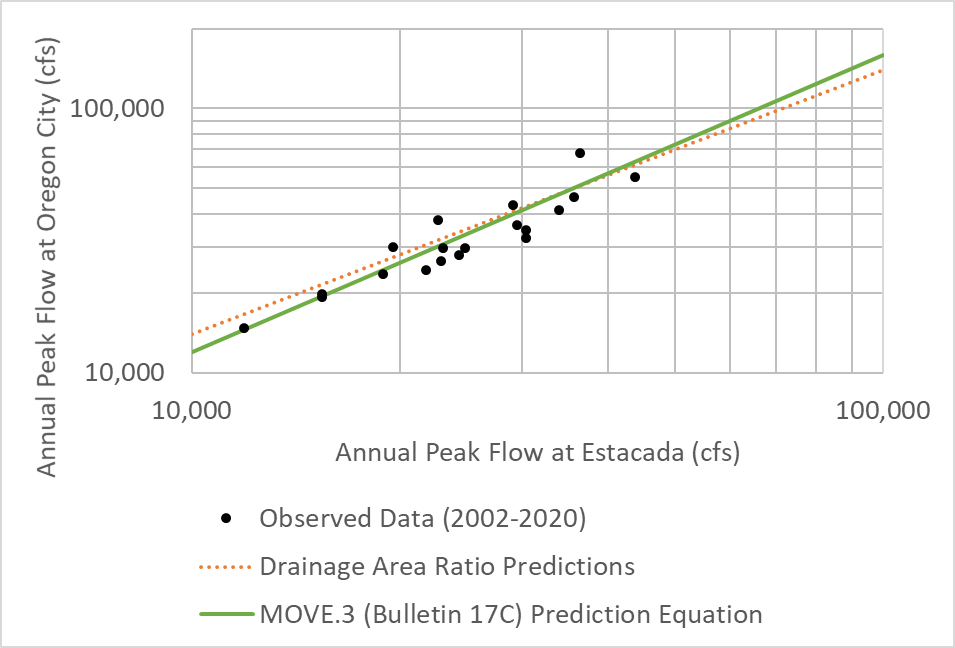
In this example, the site of interest is USGS 14211010, Clackamas River near Oregon City. It only exists for about 20 years from 2001-2020, but a long-term gage exists upstream on the Clackamas River at Estacada, USGS 14210000. The drainage area at Estacada is 671 square miles, and the drainage area at Oregon City is 940 square miles, leading to a drainage area ratio of 1.4.
For this example, we'll compare the predictions of peak flow at Oregon City using a drainage area ratio to the predictions using MOVE.3. Refer to the previous example (Task 1. Create a new HEC-SSP Study and Import Data) for detail on how to perform a MOVE.3 extension using the Record Extension feature in HEC-SSP. The predictions for the period 2002-2020 are shown for both methods, with the observed data in black. Note that the drainage area ratio produces reasonable results, on par with the MOVE.3 extension.
Example 2: When Drainage Area works OK
While the drainage area ratio can produce reasonable results, it is typically best practice to use a MOVE.3 analysis when data is available. As this example shows, even when two sites are on the same river and fairly close in drainage area, the MOVE.3 approach outperforms the drainage area ratio.
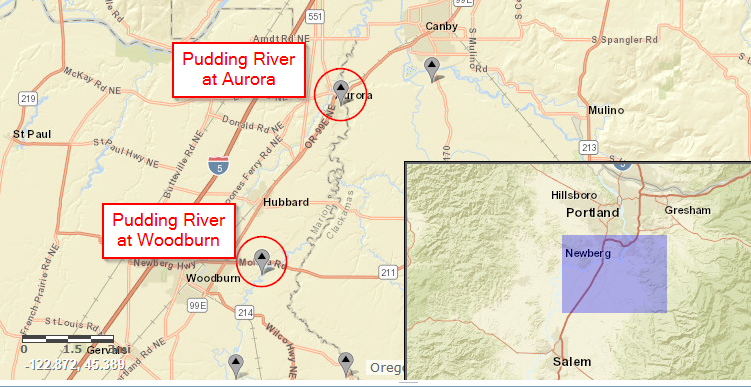
In this example, the two sites are on the Pudding River in northwest Oregon, as shown in the figure below. The Pudding River at Aurora (USGS 14202000) is the long-term site with data from 1923-2020 that is used to predict flows at the Pudding River at Woodburn (USGS 14201340) with data from 2003-2020. The drainage area at Aurora is 479 square miles, and the drainage area at Woodburn is 314 square miles, leading to a drainage area ratio of 0.66.
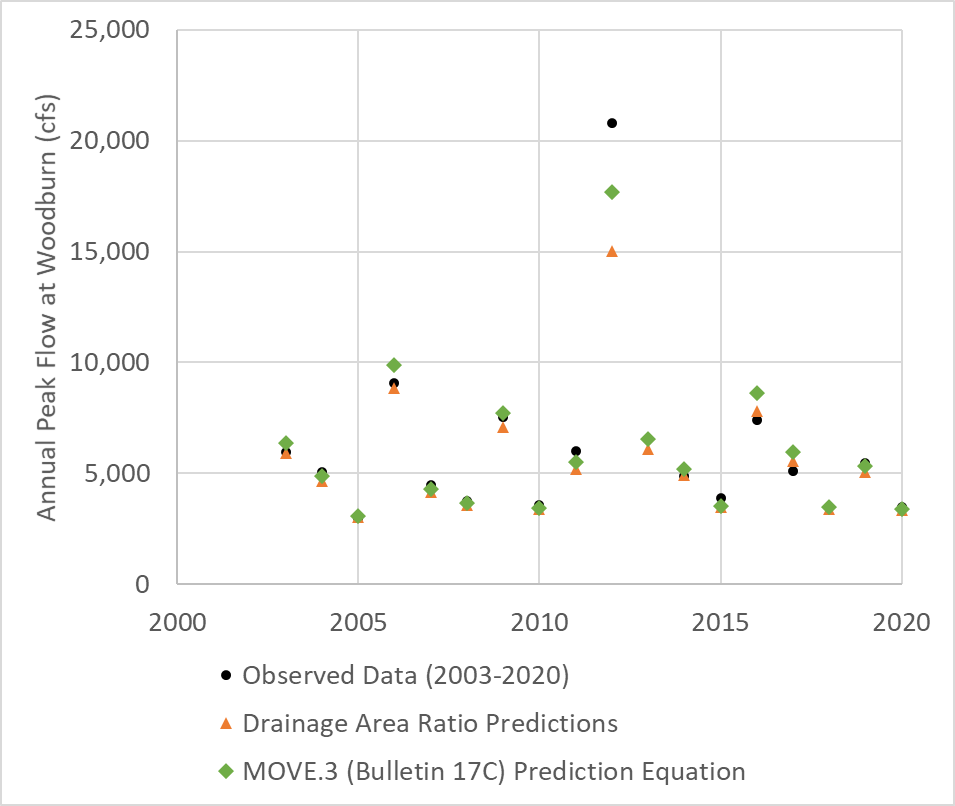
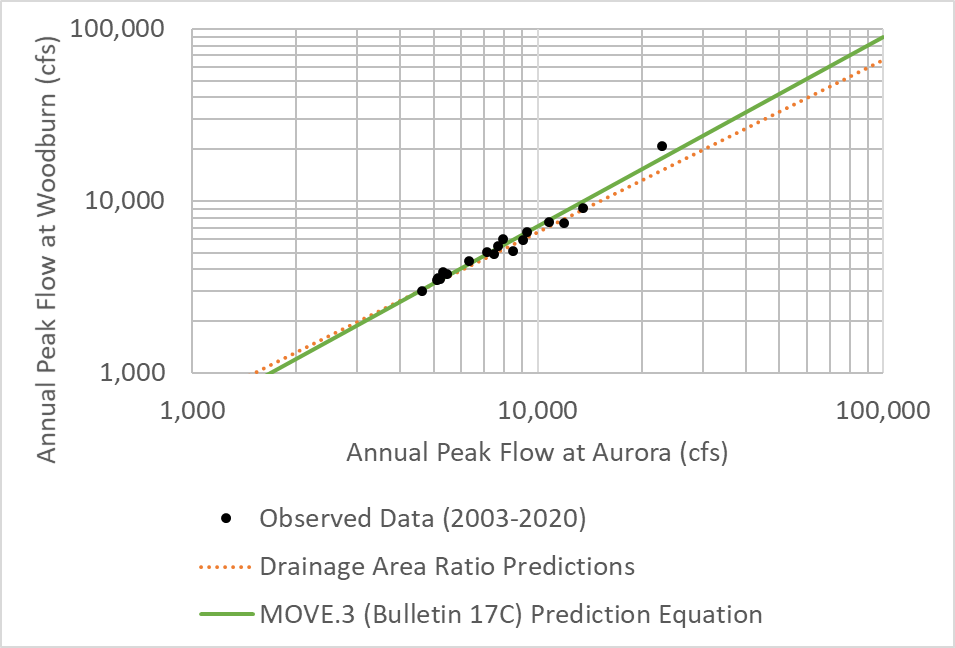
The predictions at Woodburn using both the drainage area ratio and the MOVE.3 method are shown below. The two methods fairly similar, but MOVE.3 approach produces a better estimate of the 2012 flood. This is only a single example–it would be possible to find another pair of sites where the drainage area ratio happened to produce a better estimate for the highest flood on record. However, MOVE.3 is a more consistently reliable method, mostly because it uses two parameters (slope and intercept) rather than only one in the drainage area approach (slope, with intercept assumed 0).
Example 3: When Drainage Area Ratio should be used only as a last resort
The drainage area ratio approach has been used sometimes used to predict flows when the site of interest is on a different river. The accuracy of the drainage area ratio approach becomes very questionable in these cases, and it is always preferred to do a MOVE.3 analysis in this situation when possible. The following example shows the dangers of using the drainage area ratio approach between rivers.
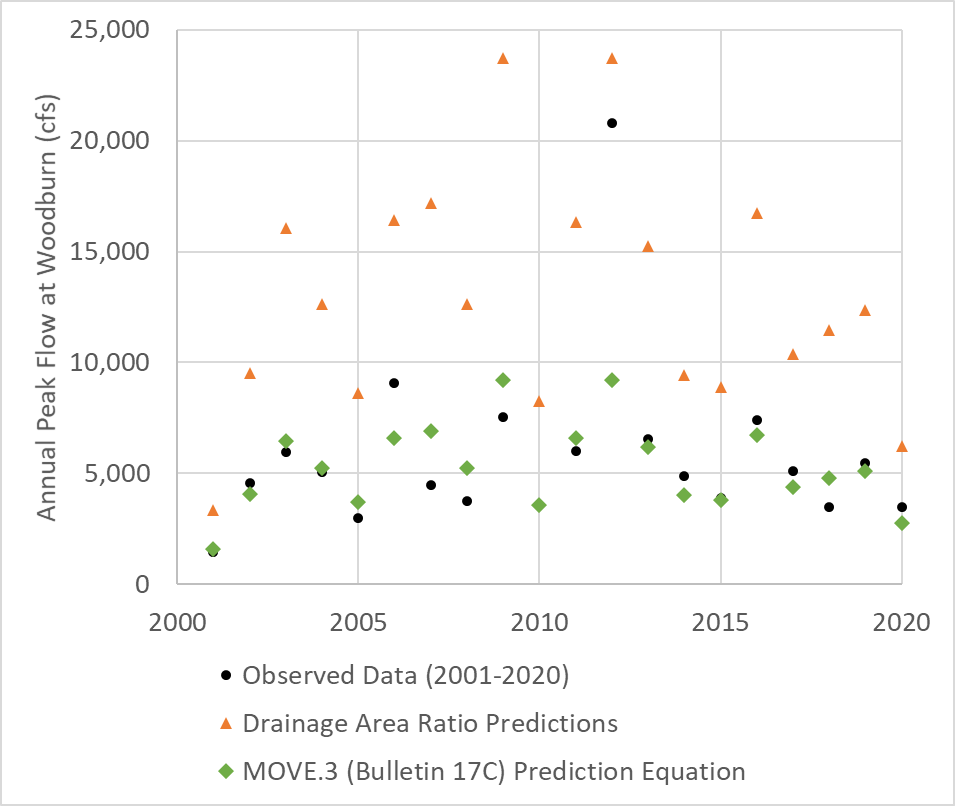
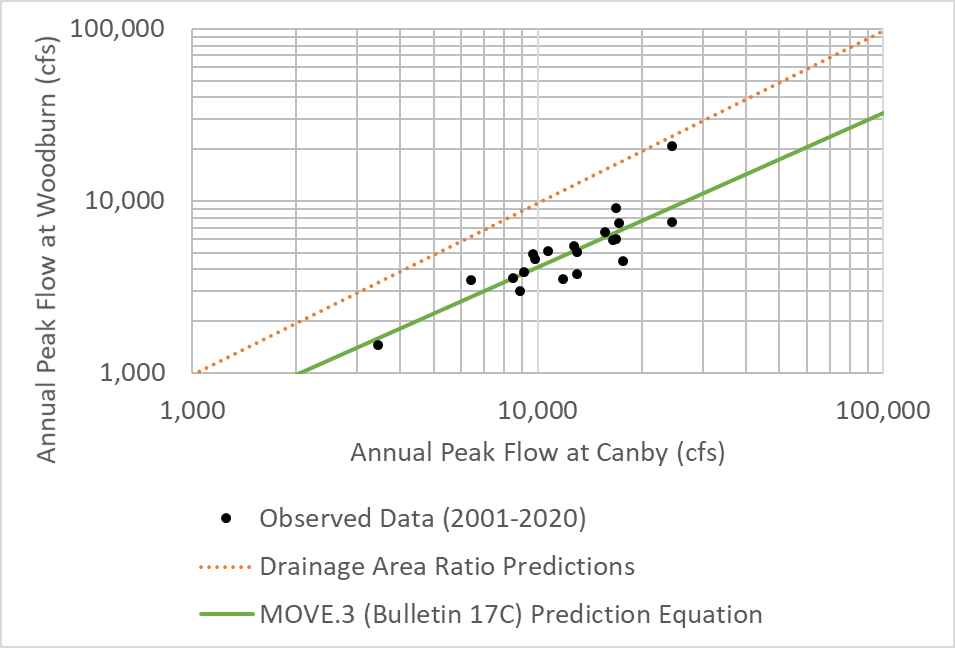
In this example, one site is the Molalla River near Canby, with a drainage area of 323 square miles. The second site is the Pudding River at Woodburn, with a drainage area of 314 square miles. We will predict flows at Woodburn using the gage records at Canby. The Pudding River and the Molalla River watersheds are directly adjacent to each other, and the drainage areas of the two sites are very close. The drainage area ratio is 0.97. This is the most ideal condition possible, and yet the drainage area ratio approach performs poorly.
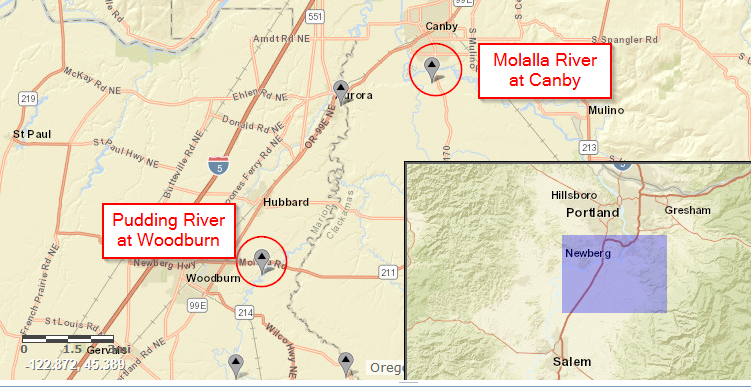
The predictions at Woodburn based on the Canby gage using both the drainage area ratio and the MOVE.3 method are shown below. Note how the drainage area ratio grossly overpredicts flows at Woodburn. While the contributing watersheds are directly adjacent to each other, the basin characteristics of the Pudding River and the Molalla River are very different. The Pudding River watershed has a much lower elevation than the Molalla River. With the strong correlation between elevation and precipitation present in this region, the Molalla River receives much larger amounts of precipitation during storm events than the Pudding River. When the basin characteristics are significantly different, the drainage area ratio approach does not perform well.
