When performing flow-frequency analyses for dam safety studies, it is imperative to integrate as much information as possible. Since observed data forms the backbone of these types of analyses, gathering and collecting as much of it as possible should be your first priority. Valuable sources of observed data include USACE Corps Water Management System (CWMS) databases, nearby USGS stream gages, and post flood reports, amongst others. A brief description of each source is shown below:
Observed Data
CWMS
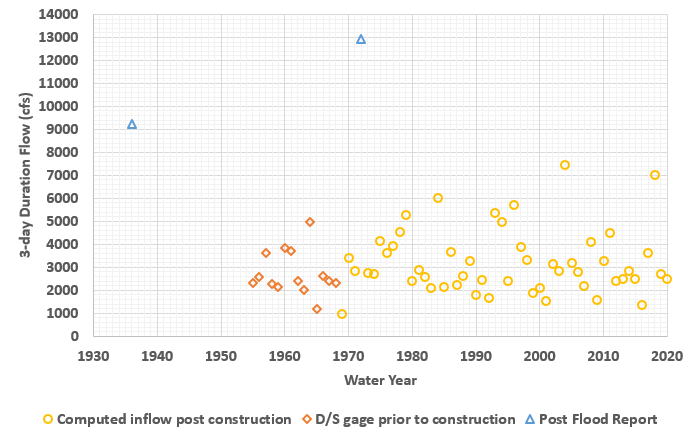
The NAB CWMS database contains historical and real-time pool elevation, observed outflow, and computed inflow time series for Sayers Dam. Instantaneous peak annual maximum inflow and daily average inflow are available starting in 1968 while continuous 15-min inflow is available starting in November 1984. The use of this data requires no adjustments prior to inclusion and adds 50 years of systematic data from 1969 - 1971 and 1973 - 2019.
USGS
Prior to construction activities commencing at Sayers Dam in June 1968, the records at the Bald Eagle Creek at Blanchard, PA gage (just downstream of the dam) were unregulated. The use of this data requires no adjustments prior to inclusion and adds an additional 14 years of systematic data from 1955 - 1969.
Post Flood Reports
The March 1936 flood event was caused by rapid snowmelt which was augmented with heavy rainfall (Grover, 1937). This was an extremely large scale event causing flooding which stretched from the Potomac River in West Virginia and Maryland to Maine. This flood event led to authorization and construction of numerous flood control projects throughout the mid-Atlantic and northeastern United States as contained within the Flood Control Act of 1936. The March 1936 event was the event of record within the Susquehanna River watershed prior to 1972. During June 1972, the remnants of Tropical Storm Agnes led to record breaking flooding along the majority of the Susquehanna River, including Bald Eagle Creek (Bailey, 1975). This event exceeded flood storage at Sayers Dam and the activation of the uncontrolled spillway. As of February 2020, this is the only time a flood control dam within the West Branch Susquehanna River has exceeded flood storage. Post flood reports detailing these events were written by USACE which describe the meteorology, hydrology, reservoir operations, and resultant damages sustained during these two extreme events. Inflow hydrographs were extracted from these reports and digitized. The use of this data requires no adjustments prior to inclusion and adds two incredibly valuable historical events.
Compilation
Data from all the aforementioned sources have been gathered for you and assembled into a complete annual maximum series (AMS) of 3-day duration inflow to Sayers Dam, which is shown in the figure below. Additionally, an instantaneous peak annual maximum series and daily average inflow time series was created in a similar fashion.
The best estimate for the critical inflow duration at Sayers Dam is 3 days.

Record Extension
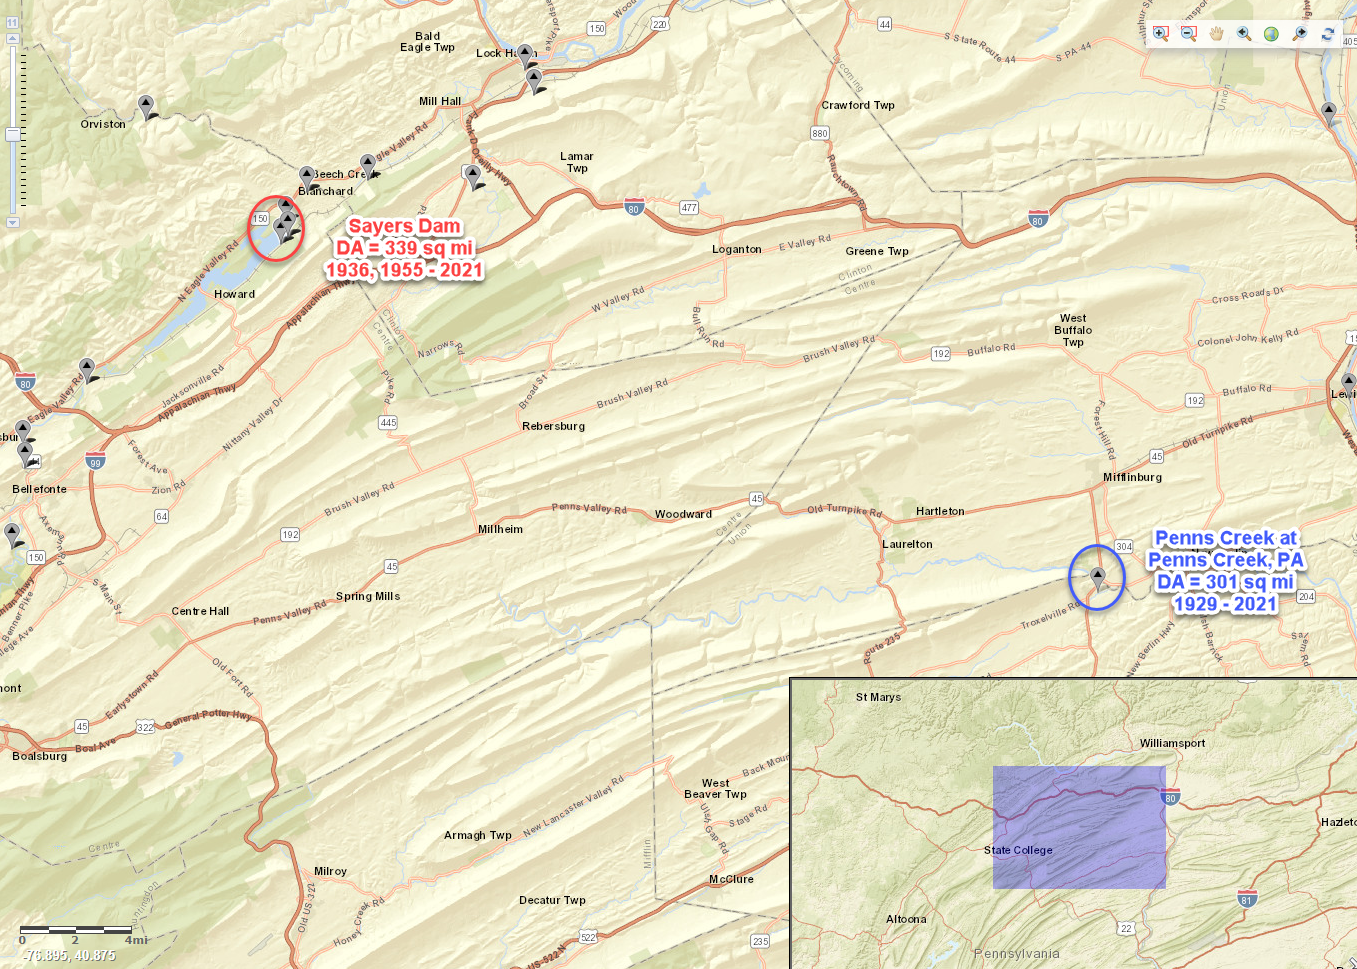
In this example, known inflow to Sayers Dam is available for 68 years in 1936 and from 1955 - 2021. Several gages are located nearby with more years of data that can be used to extend the record and improve estimates of inflow to Sayers Dam. The Penns Creek at Penns Creek, PA gage was selected to extend the Sayers Dam inflow record. This gage is shown in relation to Sayers Dam within the following figure.

Continue to Task 2. Create a new HEC-SSP Study and Import 3-day Duration Data.