Download page Task 3. Use the Record Extension Analysis to Extend the 3-day Duration Inflow Data Set.
Task 3. Use the Record Extension Analysis to Extend the 3-day Duration Inflow Data Set
In this example, known inflow to Sayers Dam is available for 68 years in 1936 and from 1955 - 2021. Nearby gages with more years of data can be used to extend the record and improve estimates of inflow. Several gages were screened within a Correlation Analysis. The Penns Creek at Penns Creek, PA gage was selected to extend the Sayers Dam inflow record.
Create a New Record Extension Analysis
ClickAnalysis|New|Record Extensionto create a new Record Extension analysis.
Name the new analysis "SayersDam_3day_MOVE3".
Under theComputational Methodpanel, ensure theMOVE.3 (Bulletin 17C)method is selected. This method will perform the record extension for annual maximum peak flows in accordance with the modified MOVE.3 procedure, as laid out in Appendix 8 of Bulletin 17C.
Within theLocationspanel, select the Penns Creek dataset as thePrimary (Long Record)and the Sayers Dam dataset as theSecondary (Short Record).
TheGeneraltab should resemble the following figure.
Compute and Visualize the Results
ClickComputeand move to theDatatab.
You should notice that statistics for the complete records, concurrent periods, and non-concurrent periods have been computed and are tabulated.
Also, a plot showing the long-term peak flows against the short-term peak flows (blue circles) is provided.
Additionally, since the analysis was computed, the extended record is also shown for the years where the short-term gage does not exist (red circles).
The red circles are shown as if the record were being extended for all years. The MOVE.3 (Bulletin 17C) method limits the number of years allowed for extending the data. TheRecord Extensiontab shows this in more detail.
TheDatatab should resemble the following figure.
Question: Why does the extended record plot along a straight line (in log space)?
TheMOVE.3 (Bulletin 17C)record extension method relies upon linear regression techniques to predict the extended record. As such, the resultant predicted flows are perfectly linear (in log space).
Move to theRecord Extensiontab.
Note that the allowable years of record extension per Bulletin 17C procedures is 12 years.
Also, the most recent 12 years have been automatically selected for you.
TheRecord Extensiontab should resemble the following figure.
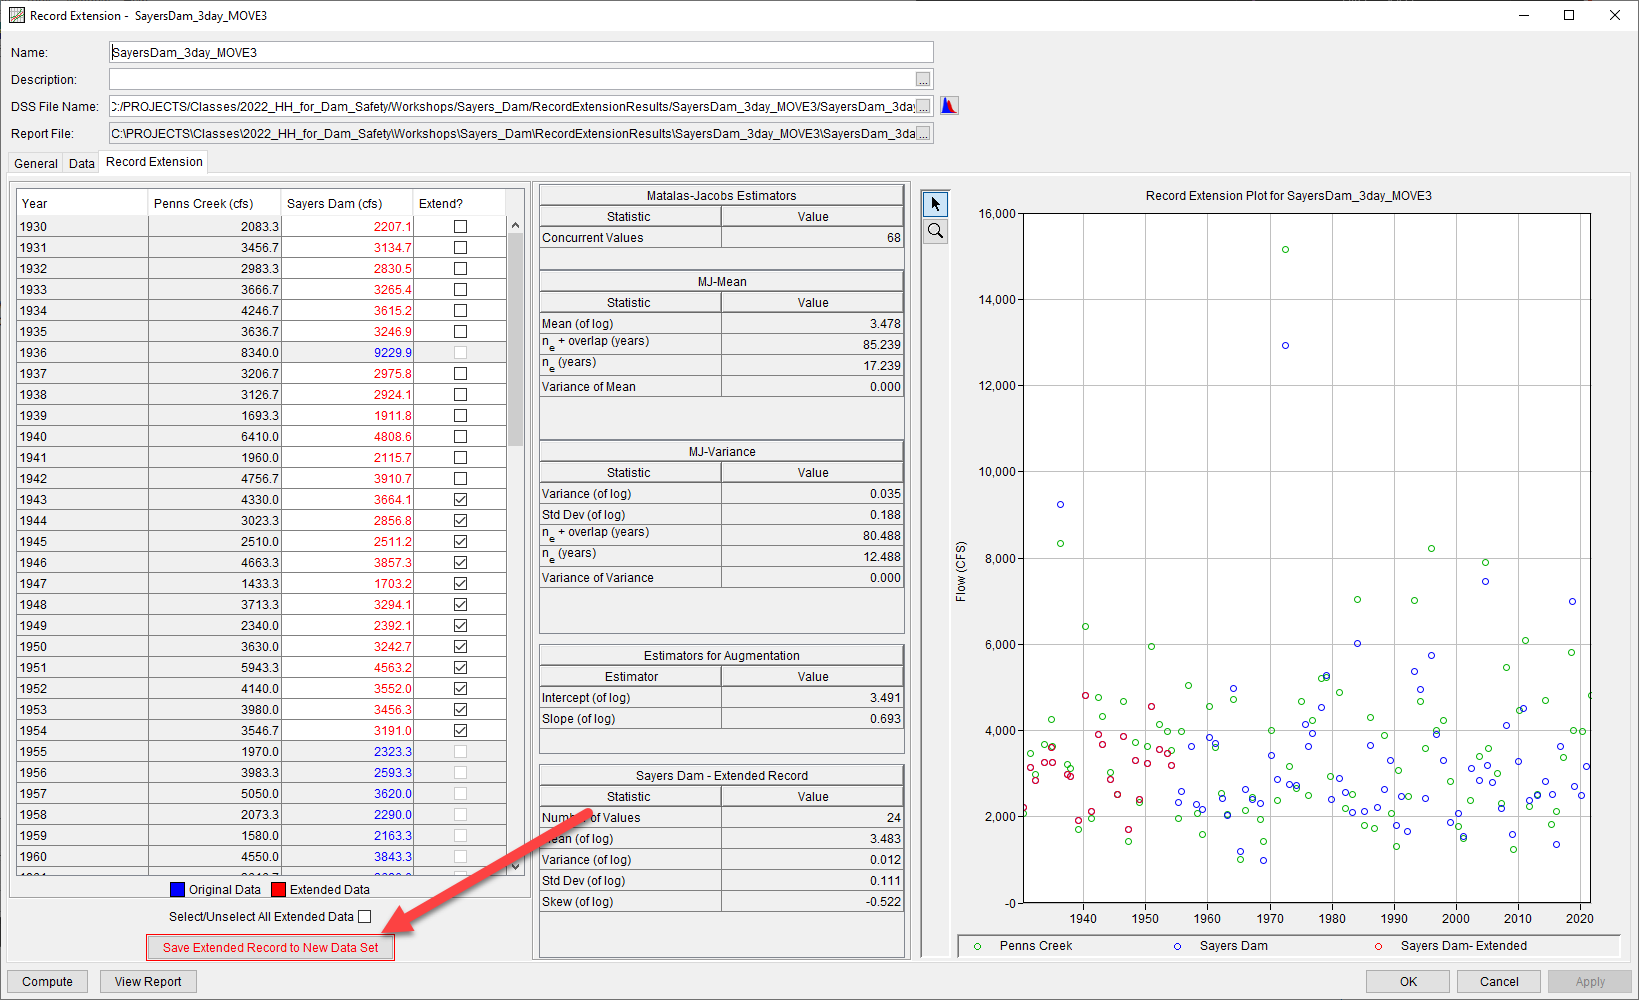
Create an Extended Record Data Set
Now that you've computed the extended record, save it to a new data set so it can be used in other analyses.
Click the Save Extended Record to New Data Set button, as shown in the following figure.
Name the new data set "SayersDam_3day_MOVE3".
Change the Short ID to match the name.
The Save as New Data Set dialog should resemble the following figure.
ClickNextand review the extended data.
When ready, clickImportto to import the extended record and return to the main HEC-SSP desktop.
Click theSavebutton () to save the study.
You should notice that the extended record was added to theStudy Explorerwindow underData.
Select the original Sayers Dam (i.e. unextended) and Sayers Dam MOVE3 data sets by holding the ctrl key and left-clicking.
SelectData | Plot. A plot containing both data sets should be presented that resembles the following figure. Notice the additional years of record contained within the extended data set.