Download PDF
Download page Task 1. Create a new HEC-SSP Study, Import Data, and Visualize Multiple Data Sets.
Task 1. Create a new HEC-SSP Study, Import Data, and Visualize Multiple Data Sets
Creating a New HEC-SSP Study
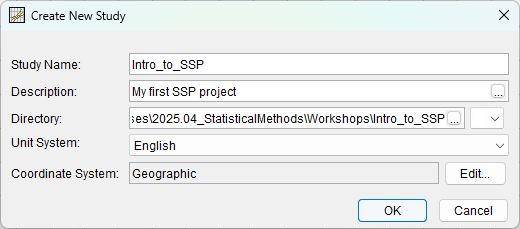
The first step in performing a frequency analysis within HEC-SSP is to establish which directory you wish to work in and to enter a title for the new study.
- Create a new HEC-SSP study.
- Name this project "Intro_to_SSP".
- Select an appropriate directory.
- Leave the Unit System and Coordinate System set to their default values of English and Geographic, respectively.
Restricted Special Characters
Do not use the following special characters in HEC-SSP: #%!/\&
Importing Data
Before any analyses can be performed, data must be imported to the HEC-SSP study. For instance, when performing a peak flow-frequency analysis, an annual maximum series of streamflow must be imported. Multiple methods are available to import data to an HEC-SSP study including from an existing HEC-DSS file, from the United States Geological Survey (USGS) website, from a Microsoft Excel file, from a text file, and manually.
Importing Data from the USGS Website
First, you will import several data sets from the USGS website.
- Click Data | New | Using Import Wizard to open the new Data Importer Wizard.
- Leave the default selections unchanged and select Next.
- On the next panel, select USGS Website as the source. Click Next.
- On the "Import from USGS Website" panel, ensure the Data Type is set to Annual Peak Data, Flow data is selected, and Get USGS Station ID's by State is selected.
- Click the Get ID's for State button.
- Within the pop up window, select Pennsylvania. Then, click OK to search for all gages with annual peak data in Pennsylvania. Once the search has completed, click OK and then click Next to begin perusing the returned data sets.
- Navigate to the Aquashicola Creek at Palmerton, PA data set. The USGS gage number for this station is 01450500.
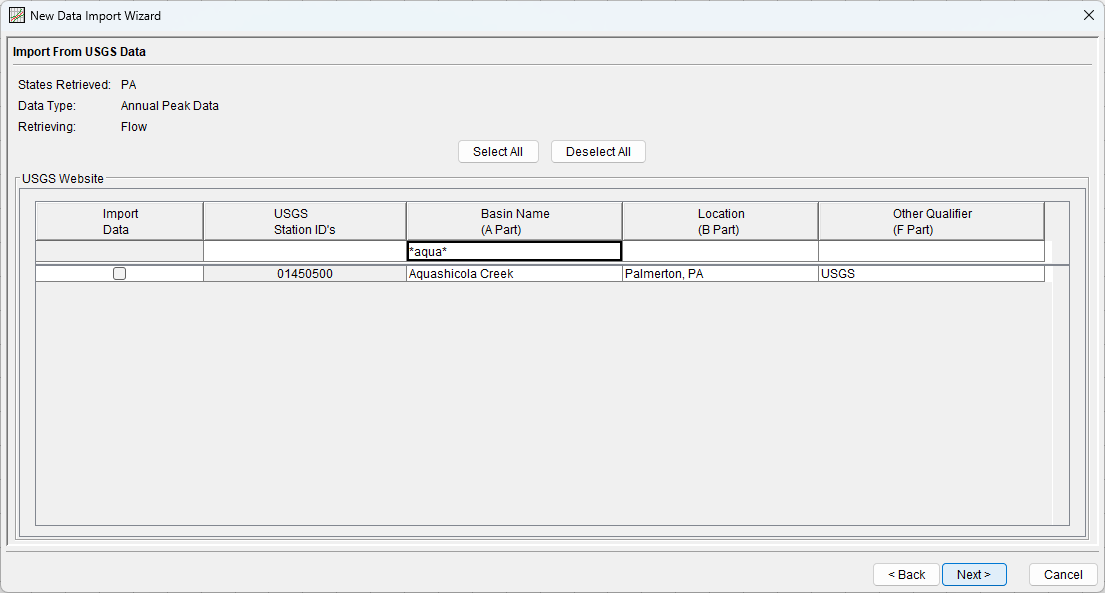
You can use the Station ID, A-part, and B-part drop down menus/entry fields to more easily navigate to a particular station (or list of stations). For instance, you can type *aqua* within the A-part field and hit Enter to limit the number of sites displayed to those that contain the text string "aqua", as shown below.
- Once the station has been found, click the check box in the Import Data column and click Next.
- On the next panel, review your selection to ensure everything is correct. Click Import when ready.
- A pop up message should inform you that the data was successfully imported along with any available USGS Qualification Codes. Click OK to close these windows.
- Review your data, and click Close to return to the main HEC-SSP desktop.
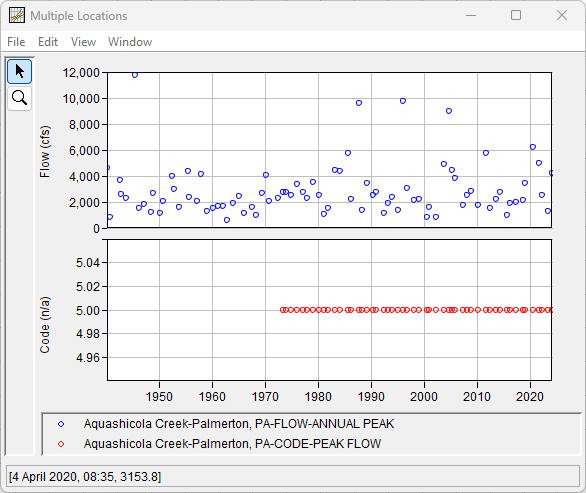
- Once the data set has been imported, you can tabulate, plot, or edit it within the Study Explorer (or within the Map). Select the two data sets (one containing peak flows and another containing USGS qualification codes) that were just imported by holding either the Ctrl key or the Shift key and left clicking. Then, click Data | Plot. A new window will appear containing the two data sets in two different viewports each sharing a common x-axis, as shown below.
- Click on the magnifying lens tool (
 ) and zoom in/out within the plot.
 - Also, try zooming along the x- and y-axis; this will maintain the scale of the opposite axis. For example, if you zoom along the x-axis, the y-axis scale will stay the same.
- Click on an object within the legend. You should see that the selected data set will highlight within the plot allowing for easier identification.
- Click File | Tabulate. A new window will open displaying the tabular data contained within the plot. If so desired, this information can be selected, copied, and pasted to Excel (along with several other functions).
- Click on the magnifying lens tool (
- Close all of the plots and tabular windows.
- Click the Save button (
 ) to save the study.
Notice that when you save the study, the asterisk next to the study name disappears.

Now, you'll import daily data for the same site, which requires a separate pass through the Data Import Wizard.
- Click Data | New | Using Import Wizard to open the new Data Importer Wizard.
- Leave the default selections unchanged and select Next.
- On the next panel, select USGS Website as the source.
- On the "Import from USGS Website" panel, select the Daily type, the Retrieve Period of Record checkbox, and the Flow checkbox.
- Click the Get ID's for State button.
- Within the pop up window, select Pennsylvania. Then, click OK to search for all gages with annual peak data in Pennsylvania. Once the search has completed, click OK and then click Next to begin perusing the returned data sets.
- Navigate to the Aquashicola Creek at Palmerton, PA data set. The USGS gage number for this station is 01450500.
- Once the station has been found, click the check box in the Import Data column and click Next.
- On the next panel, review your selection to ensure everything is correct. Click Import when ready.
- A pop up message should inform you that the data was successfully imported. Review your data, and click Close to return to the main HEC-SSP desktop.
- Once the data set has been imported, you can tabulate, plot, or edit it within the Study Explorer (or within the Map). Select the previously imported peak flow data set along with the just-imported daily flow data set by holding the Ctrl key and left clicking. Once the two data sets have been selected, click Data | Plot. A new window will appear containing the two data sets, as shown below.
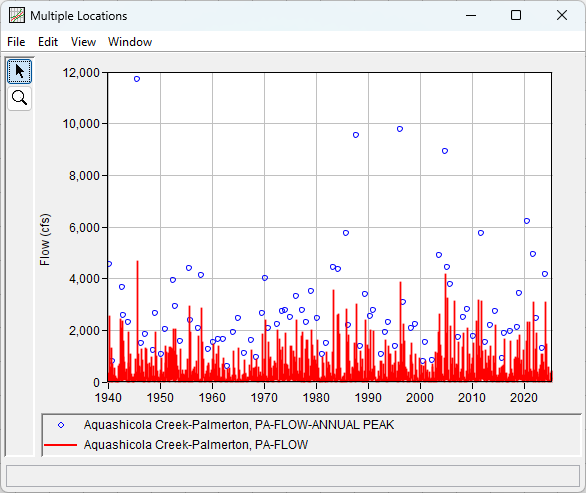
Question 1: Within this plot, you should notice that the instantaneous annual maximum peak flows are much larger than the daily average flows. Why do you think that is the case? What can you infer about the watershed upstream of this gage location?
Daily average flows are computed by averaging all of the instantaneous observed flows throughout the entire day. As such, the computed daily averages must be equal to or less than all of the instantaneous observed flows. It is likely that the watershed upstream of this gage location is small and runoff responses are quick (i.e. “flashy”).
Importing Data from an Existing DSS File
Next, you will import a data set from an existing DSS file.
- First, save the study by clicking the Save button (
 ).
). - Click Data | New | Using Import Wizard to open the new Data Importer Wizard.
- Enter a Short ID of "Palisades Pool Elevation" and click Next.
- Change the Source to HEC-DSS, and click Next.
- Click the ellipsis button within the Selected DSS File entry field, as shown in Figure 4.

- Within the pop up window, navigate to the Palisades_Elevations.dss file. Click Open to select this file. This will cause the contents of the selected DSS file to populate within the table listing selectable data sets.
- Double left click on the Palisades Elevation data set (C-part of "ELEV") to add it to the window at the bottom of the Data Importer. This window shows the data sets that are waiting to be imported to the study.
- Click Next and review your data one last time.
- When ready, click Import to to import the data set and return to the main HEC-SSP desktop.
- Click the Save button (
 ) to save the study.
 - Once the data set has been imported, it can be tabulated, plotted, or edited within the Study Explorer (or within the Map).
Importing Data from an Excel File
Now, you will import a data set from an existing Excel file.
- Click Data | New to open the Data Importer Wizard.
- Enter a Short ID of "Randolph Pool Elevation" and click Next.
- Change the Source to MS Excel, and click Next.
- Click the ellipsis button within the Excel File entry field.
- Select the Randolph_Elevations.xlsx file, and click Open.
- Within the pop up window, all tabs within the Excel file will be shown along the bottom. Ensure the "Annual_Max_Series" tab is selected and click Next.
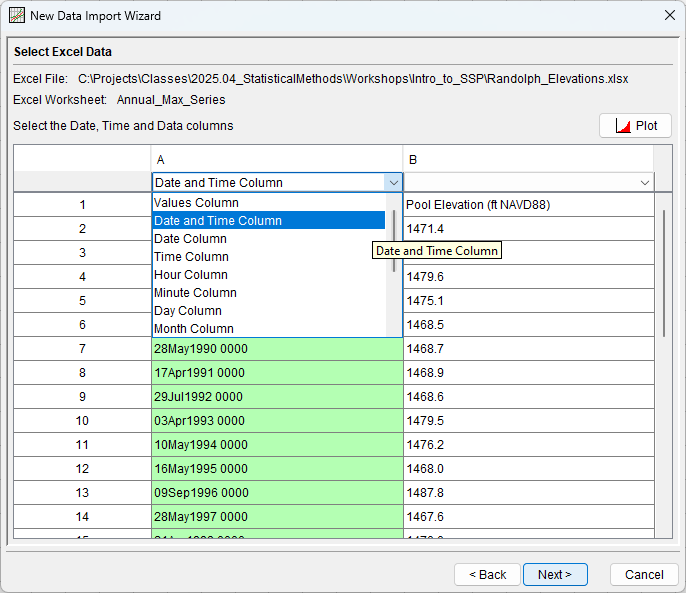
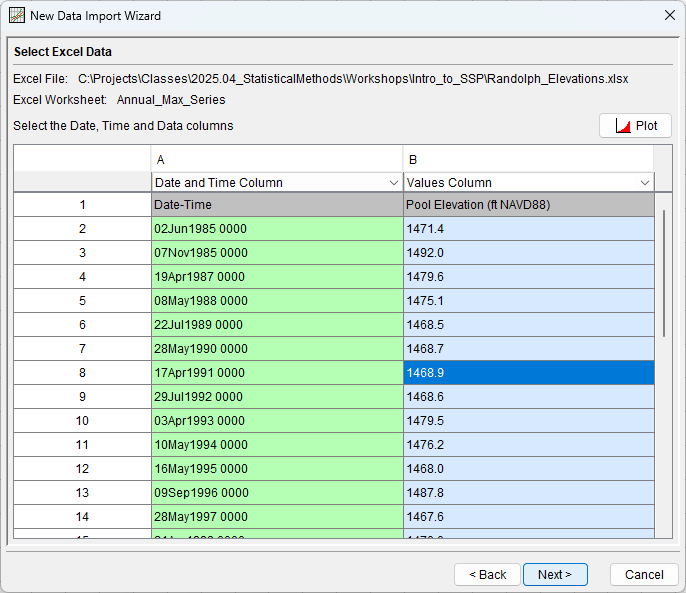
- On the following panel, click the drop down menu under column A and select "Date and Time Column", as shown below.
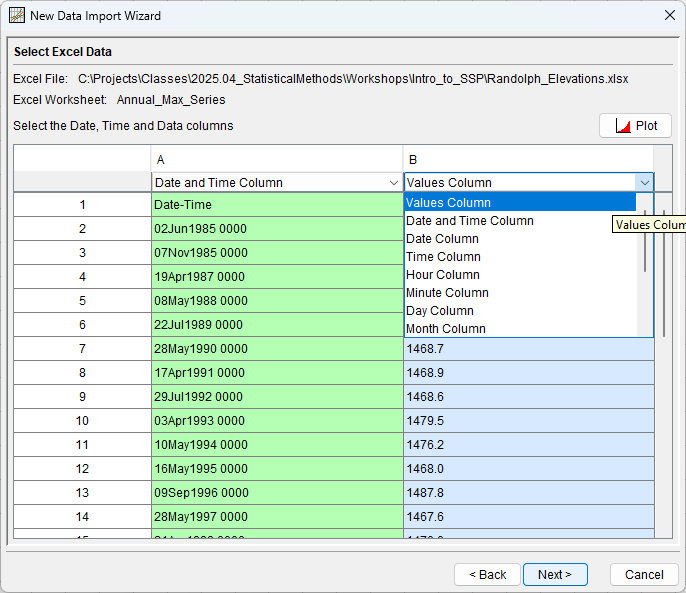
- Click the drop down menu under column B and select "Values Column", as shown below.
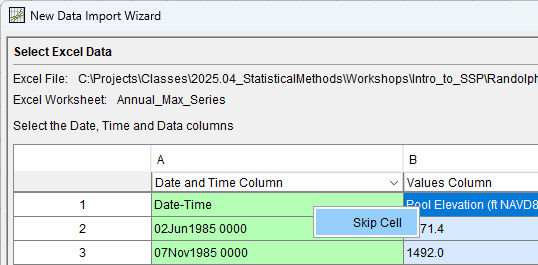
- Right click within cell A1 and select Skip Cell, as shown below.
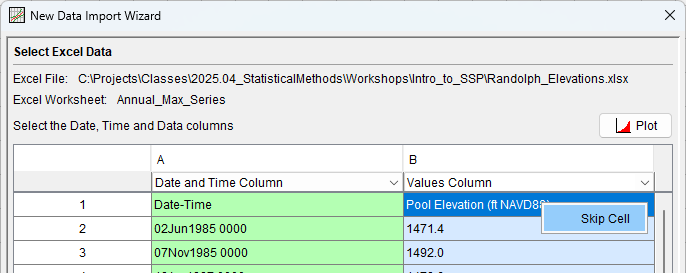
- Right click within cell B1 and select Skip Cell, as shown below.
- The Data Import Wizard should resemble the figure below
- Click Next.
- Select DSS options for the data set that will be imported:
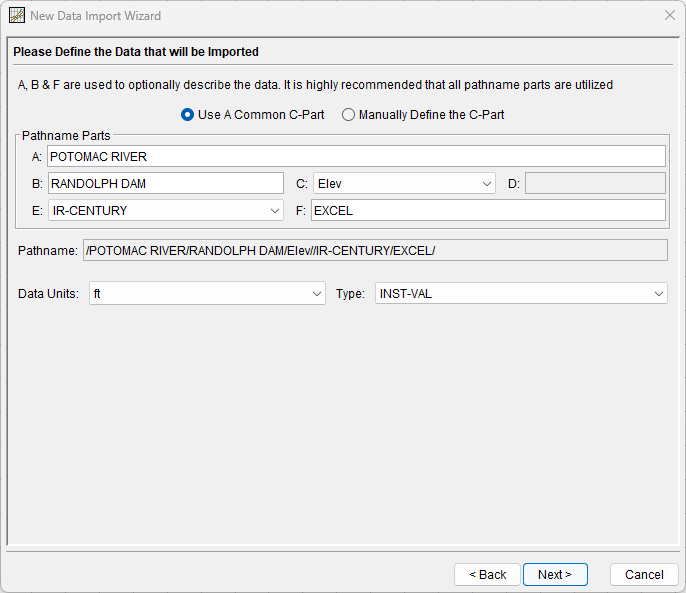
- Ensure the "Use A Common C-Part" radio button is selected
- A-part = "POTOMAC RIVER"
- B-part = "RANDOLPH DAM"
- C-part = Ensure "Elev" is selected within the drop down menu
- D-part = Leave this field blank
- E-part = Ensure IR-Century is selected within the drop down menu
- F-part = "EXCEL"
- Ensure the Data Units are "ft".
- Ensure the Type is "INST-VAL".
- The DSS options panel should resemble the figure below.
- Click Next and review your data one last time.
- When ready, click Import to to import the data set and return to the main HEC-SSP desktop.
- Click the Save button (
 ) to save the study.
 - Once the data set has been imported, it can be tabulated, plotted, or edited within the Study Explorer.
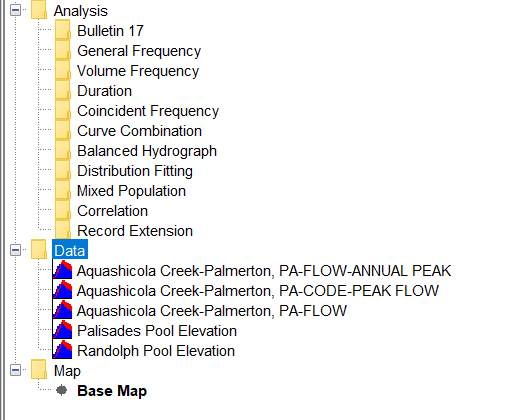
- The list of data sets contained within the Study Explorer should appear similar to the figure below.
Continue to Task 2. Create and Parameterize a Bulletin 17 Analysis.