This R Notebook is the second task in a two-part workshop on regional frequency analysis. We will be performing regional precipitation frequency analysis for Buford Dam, located 35 miles northeast of Atlanta, Georgia.

This task focuses on using the annual maximum series (AMS) of numerous gages to perform regional frequency analysis using the method of L-moments. We will rely on the lmom and lmomRFA packages in R. The key steps include:

  1. Loading and visualizing the precipitation data.

  2. Extracting spatial parameters from raster data.

  3. Estimating at-site and regional L-moments.

  4. Performing regionalization and testing for homogeneity.

  5. Evaluating distribution fitting.

For more information on the lmom and lmomRFA packages and for example R code: https://cran.r-project.org/web/packages/lmom/lmom.pdf https://cran.r-project.org/web/packages/lmomRFA/lmomRFA.pdf

Plan to spend approximately 30 minutes on this task.

  1. If the R Project is not already open, open it from R Studio by selecting File > Open Project... and selecting the R Project file: "Regional_Precip_Frequency_Workshop.Rproj" included in the project files.
  2. If you are not sure, you can view what project (if any) is currently loaded by viewing the top right of the toolbar in R Studio. You can also open and close projects directly from this drop-down.

  3. In the bottom right under the "Files" tab, you can view all files contained within the R Project.


  4. Select the file "task2_regional_frequency_analysis.Rmd" to begin the task.
  5. All workflow is contained within the .Rmd Notebook. It is recommended to switch to "Visual" mode rather than "Source" mode for a more readable display.

Tip

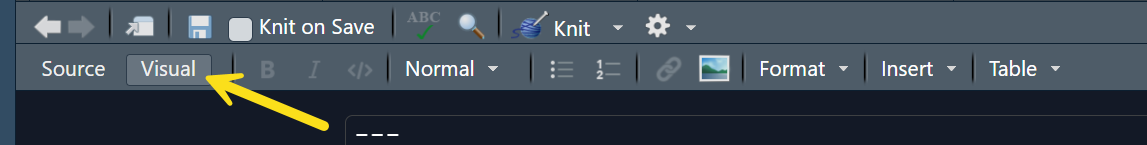
In some versions of R Studio, there is a known issue where inline chunk execution (using the play button) may run a different chunk of code than the chunk selected when in Visual mode. If this happens, try switching to Source mode then back to Visual mode to fix the issue.