Once the analysis name has been entered, the user can begin defining the analysis. Contained on the Coincident Frequency Analysis editor are five tabs. The tabs are labeled General, Variable A, Variable B, Response Curves, and Results. The first tab contains general settings for performing the coincident frequency analysis (Figure 1). These settings include:
- Variable A
- Variable B
- Output Labeling
- Y-Axis Scale
- Output Frequency Ordinates

Variable A
This option, shown in Figure 2, allows the user to choose whether the coincident frequency analysis assumes variables A and B are independent or dependent. When variables A and B can be assumed independent, there will be only one frequency curve for variable A. A conditional variable A frequency curve assumes variables A and B are not independent, so there will be a separate variable A frequency curve for each variable B index value.

Variable B
This option, shown in Figure 3, allows the user to define the number of index values for variable B. The index points are used to discretize the duration curve. A probability, or a proportion of time, will be assigned to each index point.

Output Labeling
This option, shown in Figure 4, allows the user to enter labels for data contained in the output tables and plots. The user must enter the name of the data as well as the data units. The output labeling does not result in the conversion of data from one unit system to another; it only affects what is displayed on table headings and the y-axis of the results plot.

Y-Axis Scale
This option, shown in Figure 5, allows the user to choose the scale of the y-axis. The options are Linear and Log. This option will affect the y-axis scale in the coincident frequency curve plot.

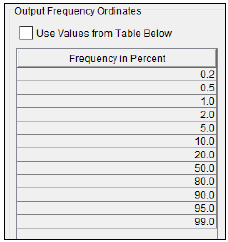
Output Frequency Ordinates
This option, shown in Figure 6, allows the user to change or add to the frequency ordinates for which the resulting frequency curve and confidence limits are computed. The default values listed in percent chance exceedance are 0.2, 0.5, 1, 2, 5, 10, 20, 50, 80, 90, 95, and 99. Check the box next to Use Values from Table below to change or add additional values. Once this box is checked, the user can add/remove rows and edit the frequency values. To add or remove a row from the table, select the row(s), place the mouse over the highlighted row(s) and click the right mouse button. The shortcut menu contains options to Insert Row(s), Append a Row, and Delete Row(s). The program will use the default values, even if they are not contained in the table, when the Use Values from Table below option is not checked. Finally, all values in the table must be between 0 and 100. Note that these values have no impact on the computed frequency curve, but rather only the values of the curve that are reported.
