Attaching a Debugger to HEC-WAT to debug a plugin
Debugging Plug-ins through Netbeans and HEC-WAT
It can be complicated to know why or how a plug-in is failing without being able to run the source code for the WAT. This document describes a way to facilitate stepping into your plug-in project while the HEC-WAT instance is running so you can debug your plug-in (and step into some WAT classes).
Once you have written your plug-in and have added the plug-in jar to the jar/ext folder, you can launch HEC-WAT and your plug-in should be added to HEC-WAT. If you encounter issues you would like to see via a debugging session in the Netbeans IDE, you can follow these steps.
The first step is to modify the HEC-WAT.config file. The HEC-WAT config file lives next to the HEC-WAT.exe.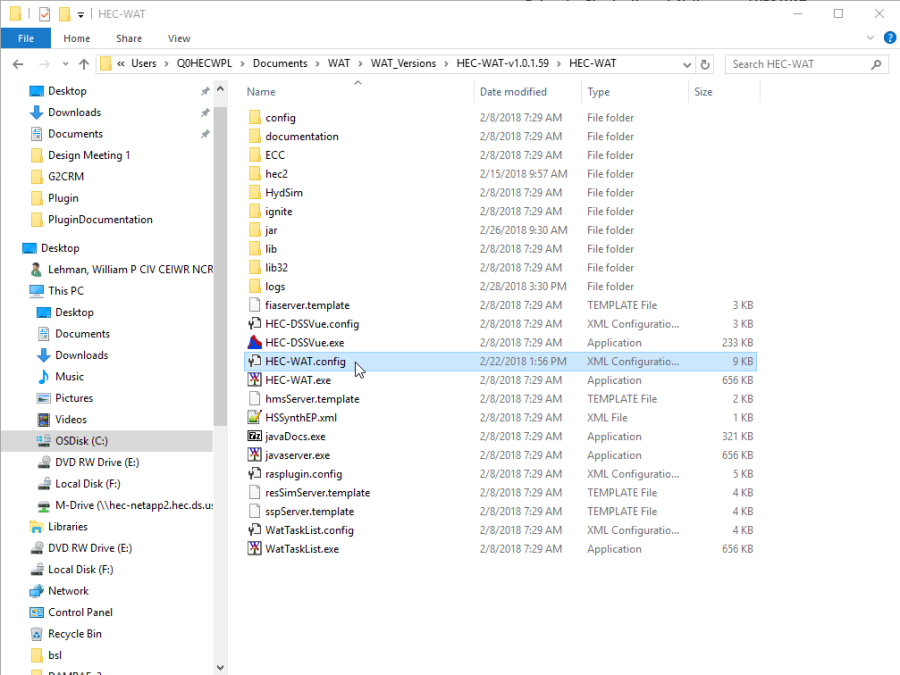
Figure 9 The HEC-WAT.config file
Add the following line to the bottom of the config file:
vmparam -Xdebug -Xrunjdwp:transport=dt_socket,server=y,suspend=n,address=5000
This line will establish a connection through port 5000 between Netbeans and the running process of HEC-WAT.
Once this line has been added, launch HEC-WAT using the HEC-WAT.exe next to the config file. Before any actions are taken in HEC-WAT, open the Netbeans IDE with your plug-in's project.
The example project we are using is the Mapper plug-in from the Simple Wat Plug-in introduction. The debug line we will enter on is the line that will first be called when the button in the toolbar is clicked.
To attach the debugger, we will click on Debug in the main menu, and then select "Attach Debugger"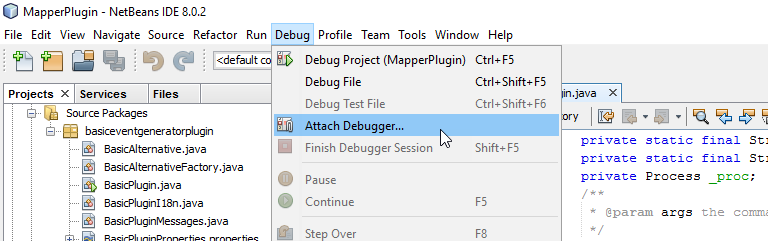
Figure 10 Attaching the debugger
Review the Attach Window settings to ensure the port number is set to 5000, and then select OK.
Figure 11 Attach Debugger Settings
The debug break line is set on line 94:
Code Example 1 The debug line
If we now click the mapper button in the toolbar, the process will stop on line 92.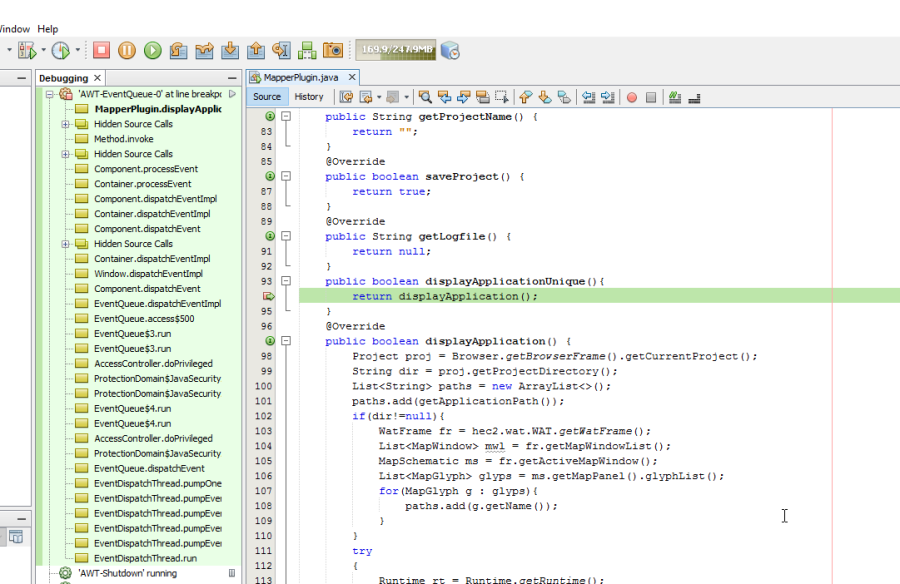
Code Example 2 Stopping at the Debug Line
This will allow us to step over or into any method. This includes methods contained in the compiled WAT jars. Be aware that some of the compiled WAT jars are obfuscated, so the debugger will not make sense in those cases.
It should be noted that certain methods are difficult to debug this way. Since WAT launches the plug-ins from their main method very early in the WAT execution path, it is nearly impossible to attach the debugger in time to catch the main method execution in a plug-in.