Results
Performance metrics results are available from a series of plots and reports that will be discussed in the following sections. Chapter 21 will provide further details on where in the HEC-WAT interface these results can be obtained. The simulation.dss file (e.g., Without_Project_
Conditions-TimeWindow.dss) contains performance metrics results (EAD, AEP) that the user can access with HEC-DSSVue (Figure 19.13) and create specific plots and reports.

Figure 19.13 HEC-DSSVue – simulation.dss File
HEC-WAT results for a performance metrics alternative are available for the active HEC-WAT FRA simulation from the HEC-WAT main window (Figure 19.3). From the Results menu (Figure 19.14), point to Performance Metrics, from the sub-menu are the available performance metrics results from HEC-WAT.

Figure 19.14 Results Menu – Performance Metrics
Select Event Results
To provide meaningful results, the user can setup how to organize those results. From the HEC-WAT main window (Figure 19.3), from the Results menu (Figure 19.14), click Select Results. The Select Event Results dialog box will open (Figure 19.15). The user can select a realization, lifecycle, and/or event, for which performance metrics results will be displayed.

Figure 19.15 Select Event Results Dialog Box
Plot EAD
For the active HEC-WAT FRA simulation from the HEC-WAT main window (Figure 19.3), from the Results menu (Figure 19.14), point to Performance Metrics, from the sub-menu click Plot EAD. The EAD with Uncertainty Plot dialog box will open (19.16), displaying (by default) the cumulative distribution function (CDF) of the EAD with Uncertainty Plot. For EAD, this plot is for all realizations. For example, in Figure 19.16, ten realizations of 500 events each (total of 5,000 events). An example of the probability density function (PDF) is provided in Figure 19.1. The CDF displayed in Figure 19.16 records the EAD from each realization, ranked from smallest to largest, plotted by the position of the record in the ranked list as an exceedance probability. Within any realization, the damage from all events are accumulated and divided by the total number of events simulated within a realization. This produces an estimate of EAD at the realization level. Each realization estimate of EAD will differ slightly from other realization estimates, based on the sampled frequency curve and sampled uncertainty in each model in the compute sequence. The average of all realization estimates of EAD is presented in the Total Mean EAD box (Figure 19.16), and the variance in the realization level EAD values represents the uncertainty around the average. Equivalently, the PDF plot presented in Figure 19.1 also describes the distribution of the realization estimates of EAD.
EAD Output Report
For the active HEC-WAT FRA simulation from the HEC-WAT main window (Figure 19.3), from the Results menu (Figure 19.14), point to Performance Metrics, from the sub-menu click EAD Output Report. A text editor will open (Figure 19.17), which contains the EAD Output Report. This report provides information about the years in a realization (i.e., 500); the number of realizations (i.e., 10); the mean EAD (i.e., $48,618,722.38); a table summarizing confidence about the mean EAD; numbers of bins (bars) (i.e., 20) for the EAD histogram; and, a table that represents the EAD histogram. This report is generated in after the completion of an FRA compute.

Figure 19.16 EAD with Uncertainty Plot Dialog Box – Plot CDF

Figure 19.17 EAD Output Report
AEP Histogram
For the active HEC-WAT FRA simulation from the HEC-WAT main window (Figure 19.3), from the Results menu (Figure 19.14), point to Performance Metrics, from the sub-menu click AEP Histogram. An AEP Histograms dialog box will open (Figure 19.18), providing a plot of the calculated AEP in a histogram. The histogram provides a graphical representation of numerical data and allows the user to discover and display the underlying frequency distribution (shape) of the numerical data. This plot is representative of all realizations (e.g., 5,000 events), and for the first watershed location (i.e., PFMW3) in the Location list (Figure 19.18).

Figure 19.18 AEP Histogram
LTEP Histogram
For the active HEC-WAT FRA simulation from the HEC-WAT main window (Figure 19.3), from the Results menu (Figure 19.14), point to Performance Metrics, from the sub-menu click LTEP Histogram. An LTEP Histograms dialog box will open (Figure 19.19), providing a plot of the calculated LTEP values in a histogram. The histogram provides a graphical representation of numerical data and allows the user to discover and display the underlying frequency distribution (shape) of numerical data. This plot is representative of all realizations (e.g., 5,000 events), and for the first watershed location (i.e., PFMW3) in the Location list (Figure 19.19).
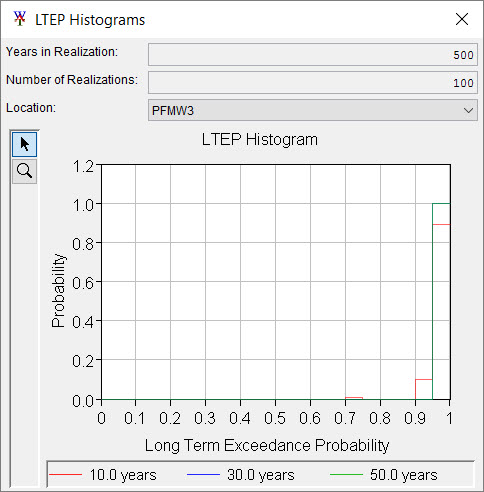
Figure 19.19 LTEP Histogram
Performance Metrics Output Report
For the active HEC-WAT FRA simulation from the HEC-WAT main window (Figure 19.3), from the Results menu (Figure 19.14), point to Performance Metrics, from the sub-menu click Performance Metrics Output Report. A text editor will open (Figure 19.20), which contains the Performance Metrics Report. This report provides information about the years in a realization (i.e., 500); the number of realizations (i.e., 10); the mean AEP (i.e., 34.57) for a specific watershed location (i.e., PFMW3); a table that is the summary of Assurance; a table of the AEP histogram; a table of the mean LTEP; and, a table that represents the LTEP histogram. This report is generated in after the completion of an FRA compute.

Figure 19.20 Performance Metrics Output Report