Application using HEC-WAT in Frequency Flow Analysis
Introduction
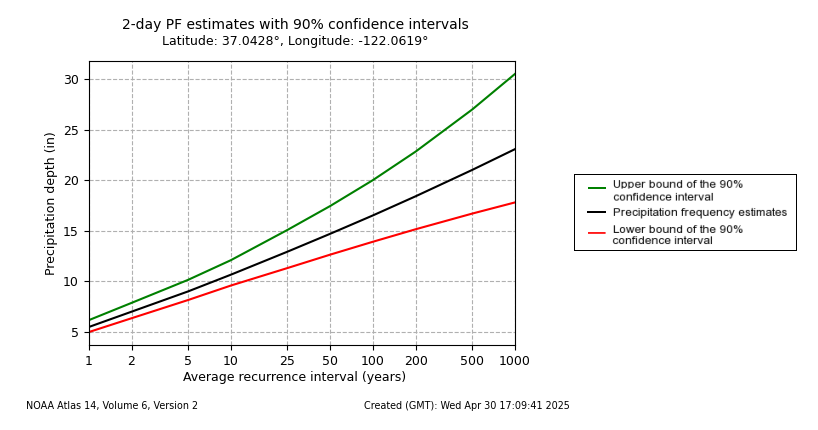
Design storms and design floods are often created in hydrologic models using precipitation‑frequency quantiles, such as the 1% annual exceedance probability. NOAA Atlas 14 provides annual precipitation‑frequency rainfall depths for nearly all locations across the United States. For each frequency (ranging from 50% to 0.1% Annual Exceedance Probability [AEP]) and duration (from 5 minutes to 60 days), the Atlas reports the median (50th percentile) rainfall depth along with the 5th‑ and 95th‑percentile confidence limits, which represent the statistical uncertainty in those estimates. These data can be accessed and downloaded as grids from the Precipitation Frequency Data Server (https://hdsc.nws.noaa.gov/pfds/index.html).
A deterministic approach is traditionally used to develop design storms and floods in hydrologic modeling. This method simplifies complex hydrologic processes by assigning fixed values to inputs and parameters, which can make analyses straightforward but may also limit the representation of real-world variability and uncertainty. Key characteristics of the deterministic approach include:
Use of median precipitation-frequency values
Design storms are typically based on median (or best-estimate) precipitation depths, assuming that the frequency of the rainfall event corresponds directly to the frequency of the resulting flood (for example, equating a 10% Annual Exceedance Probability [AEP] storm with a 10% AEP flood).
Limitation: This assumption neglects uncertainty in rainfall-runoff relationships and can lead to misestimation of flood frequency.Application of a single storm pattern or historical event
A single hypothetical storm pattern or scaled historical event is used to represent spatial and temporal rainfall distributions.
Limitation: This does not capture the variability seen in actual storm structures.Use of a regional areal reduction factor
A fixed factor is applied to adjust point rainfall depths to areal averages.
Limitation: Regional factors may not accurately represent spatial heterogeneity of rainfall within a specific basin.Fixed hydrologic parameters
Parameters such as initial soil moisture, infiltration rates, and baseflow are treated as single deterministic values.
Limitation: Ignoring parameter uncertainty can lead to systematic bias in simulated runoff and flood magnitude.
Although deterministic modeling remains common and practical for design applications, it inherently underrepresents the uncertainty associated with both meteorological inputs and watershed conditions (Ahmadisharaf et al., 2018; Yu et al., 2019). For example, NOAA Atlas 14 provides upper and lower confidence limits for precipitation depths across durations and frequencies, yet these uncertainty ranges are often not incorporated into design analyses.
HEC-WAT enables users to perform Monte Carlo sampling within the HEC software suite. The Hydrologic Sampler, a plugin integrated into HEC-WAT, allows for random sampling from precipitation or flow frequency curves. Rather than relying on deterministic simulations, HEC-WAT allows users to conduct stochastic simulations. In this approach, multiple samples are drawn from the precipitation frequency curve, producing corresponding samples of flow that can be ranked by magnitude to estimate their probabilities. Additionally, key parameters from the storm and rainfall-runoff models do not need to be assumed as fixed values; instead, users can define a range of values, and HEC-WAT will randomly select from these ranges to better represent the natural variability present in hydrologic and meteorologic processes.
This guide will demonstrate how users can set up a HEC-WAT model to perform a Monte Carlo analysis that incorporates precipitation-frequency uncertainty and basin and storm parameter variability when creating flow frequency analysis. This guide will show how to setup and prepare the HEC-HMS model and Hydrologic Sampler within HEC-WAT. Additionally, the HEC-WAT setup utilizes the Scripting Plugin to script the usage of areal reduction factors to reduce precipitation frequency rainfall based off the watershed area and the Duration Plugin to compute a 2-day volume frequency curve. The final output is an empirical flow‑frequency curve, which allows users to better represent the full range of potential flood magnitudes. In particular, examining the upper end (low‑probability, high‑magnitude flows) of the frequency curve is critical for infrastructure design, flood‑risk assessment, and risk‑informed decision‑making, as these rare but severe events often drive the most significant economic and safety consequences.
Study Area
The San Lorenzo watershed is situated in Northern California, within the Santa Cruz Mountains. The San Lorenzo River drains an area of 106 square miles and flows through the city of Santa Cruz before emptying into Monterey Bay and the Pacific Ocean. The watershed falls within "Region 7" of the A14 temporal distributions. The San Lorenzo watershed is particularly susceptible to flooding caused by atmospheric rivers storms which lead to rapid runoff in the Santa Cruz Mountains. A flow gage within the watershed on the San Lorenzo River at Big Trees (11160500) has daily and peak flow data going back to 1935. A flow frequency curve was created using data from the Big Trees gage in Modeling Flow-Frequency Relationships using HEC-HMS, results from which serve as a benchmark for comparison against the HEC-WAT model results.
The San Lorenzo watershed was selected for this study for several reasons:
- Large storm events in the area are consistently driven by atmospheric storms, the primary contributors to high flows along the San Lorenzo River.
- The watershed is relatively small with an area of 106 square miles.
- There is a long period of record available from the flow gage, providing ample data for comparing and validating results.
