Task 1: Open the Forecast and View Results
The first task is to open the forecast for this workshop and view results.
- Launch CWMS.
- Click on File | Open Watershed and select Workshop_HEC_RussianRiver.
- Navigate to the Modeling Module by selecting the Modeling tab in the study window.
- Select the Forecast menu option and choose Open. In this window, select the forecast titled HEC-HMS Model Calibration in CWMS
- You should see a map of the watershed and forecast information as shown below.
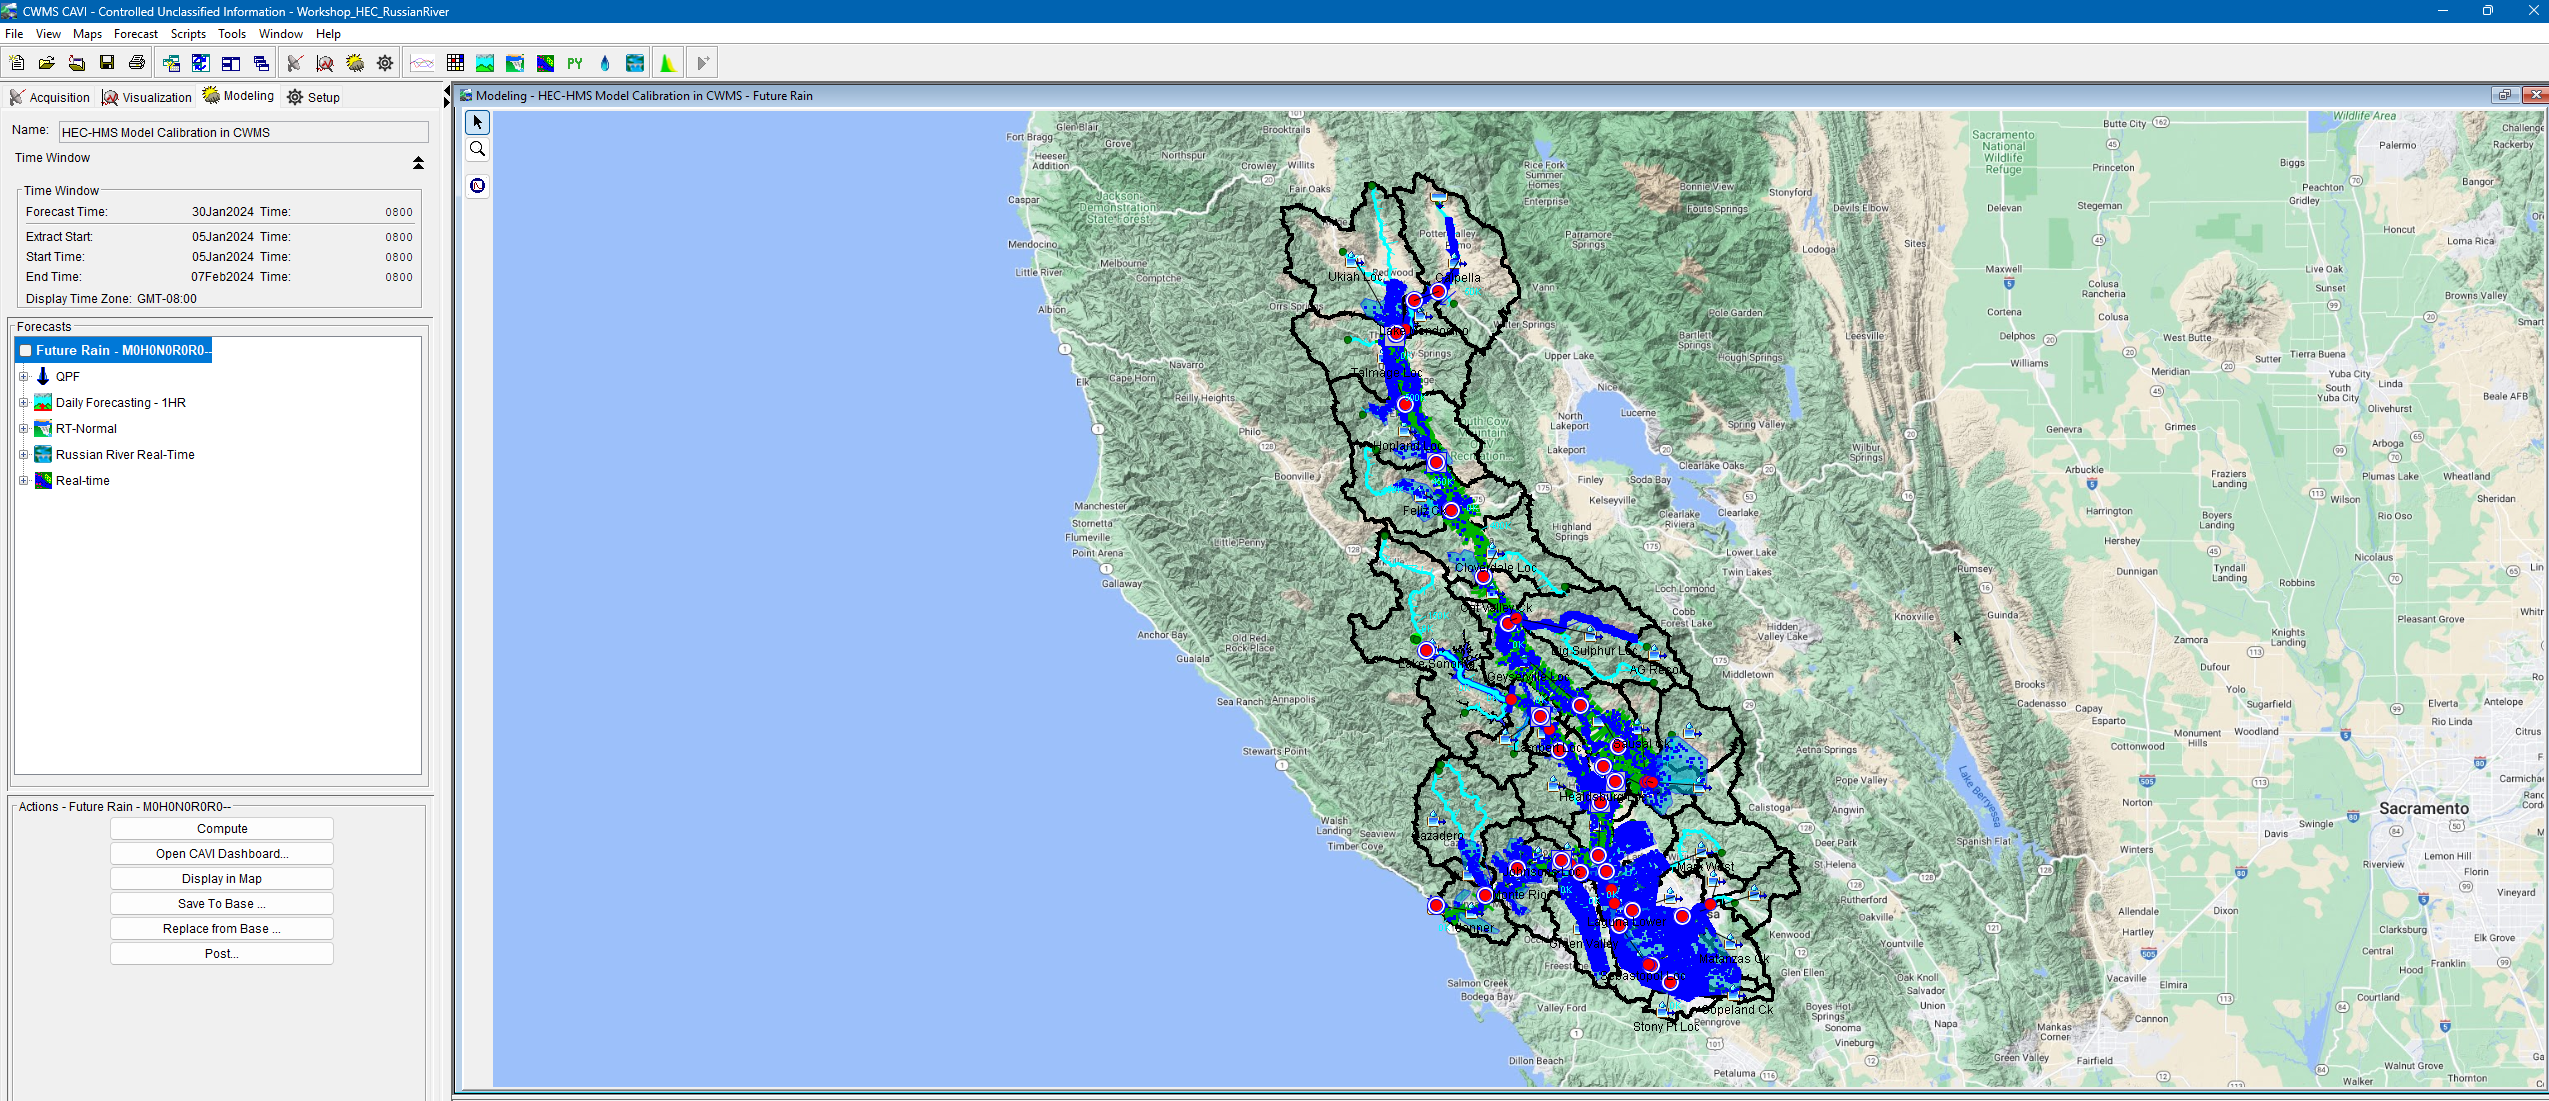
- Notice the QPF HEC-MetVue alternative is being skipped in the compute sequence. This is because the HEC-MetVue alternative has already been successfully computed for the forecast.
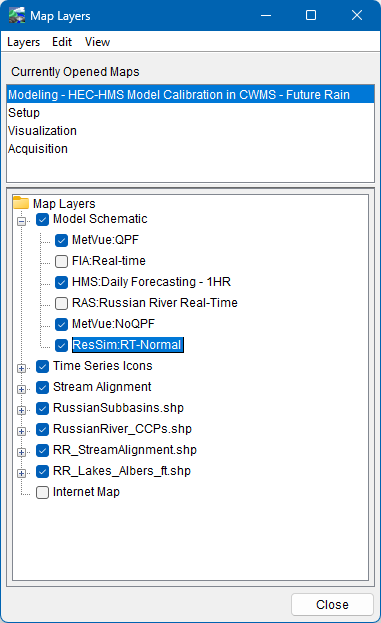
- Notice the background map contains map layers for all model alternatives and time series icons showing flow observations. You can turn some off these visual layers to help you focus on specific tasks. Go to the Maps menu and choose Map Layers. Within the Map Layers editor, expand the tree node for Model Schematic and uncheck FIA and RAS model information, as shown below. You can turn these back on when needed. You can also turn off the Internet Map. Click the Close button to close the Map Layers editor.
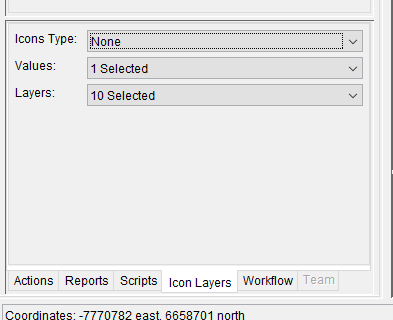
- Select the Icon Layer tab at the bottom left window. As shown below, you can turn off the Icons from displaying in the map. Set the Icons Type to None.
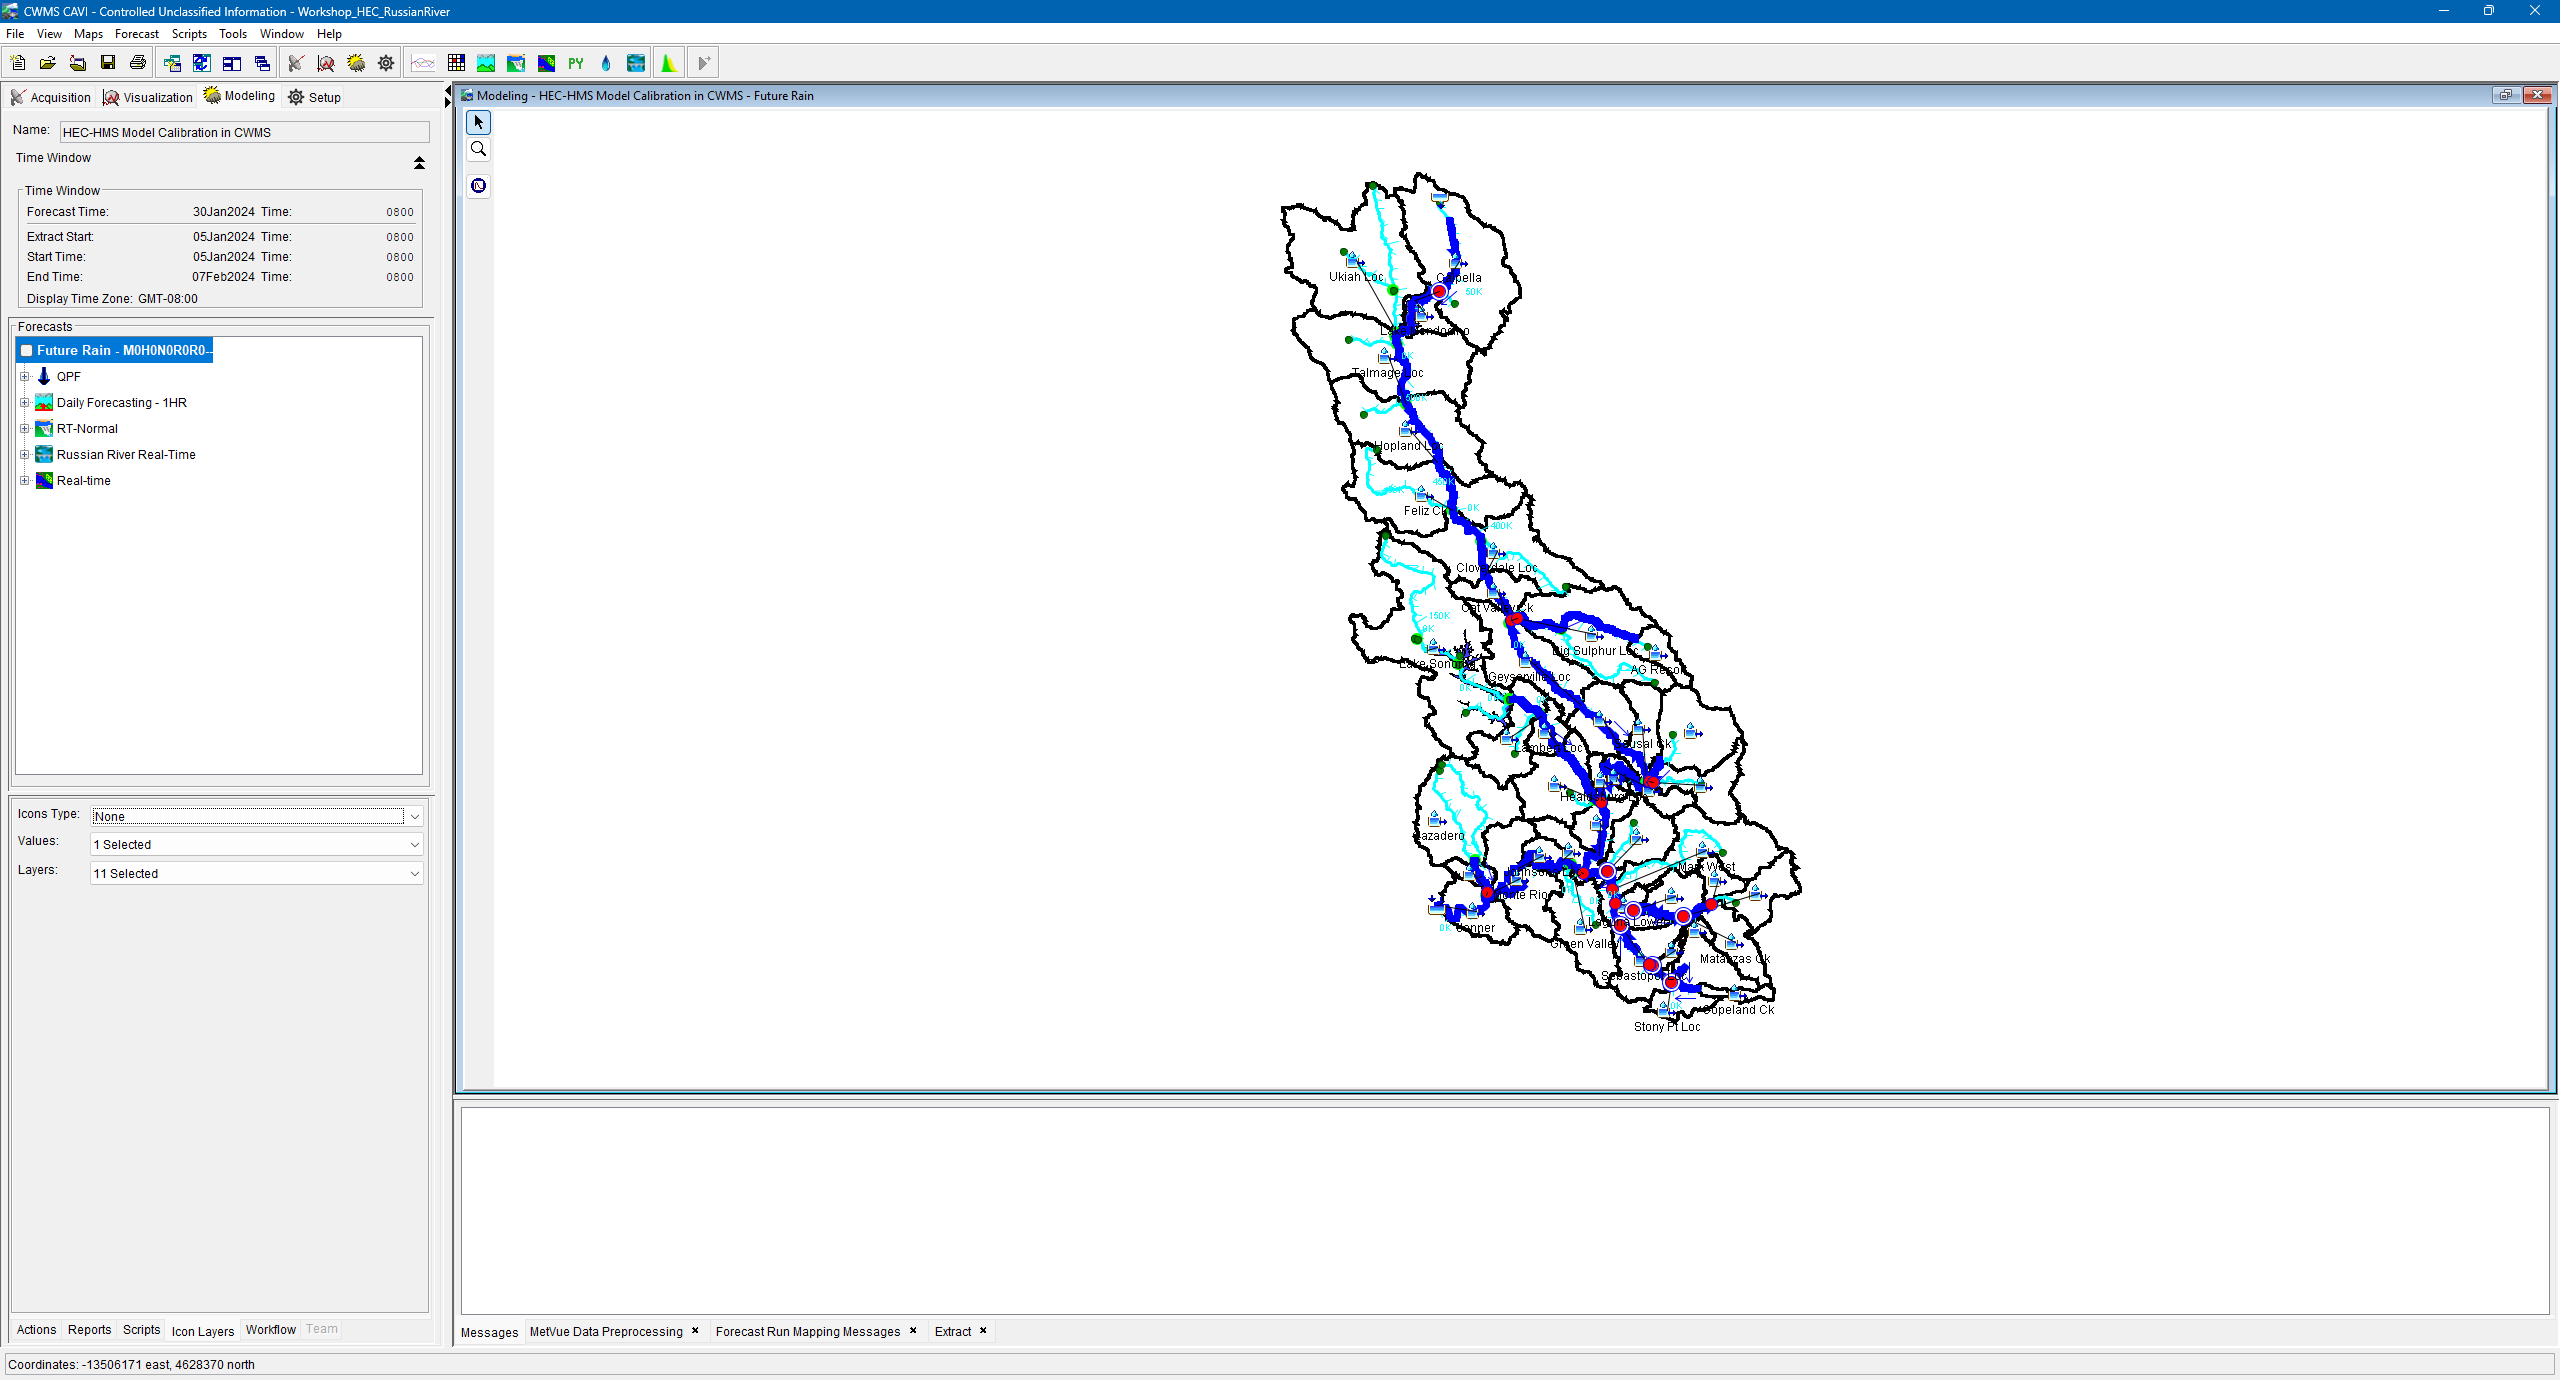
- The following figure shows the Modeling map after some of the map layers were turned off. Turning off some of the layers will help you access results from the map interface more efficiently.
- Run the Daily Forecasting - 1HR HEC-HMS alternative. You will notice the HEC-HMS forecast run takes about 15 seconds to complete.
Messages
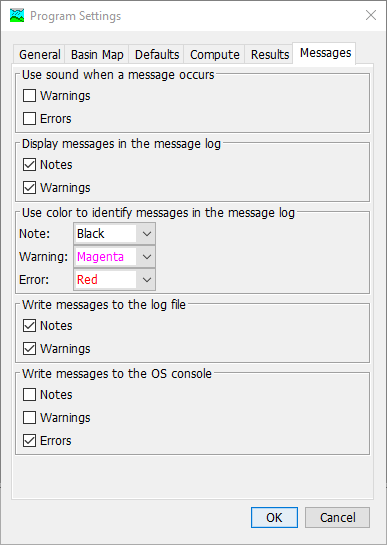
You can control the amount of HEC-HMS messages written to the message window and log file. First Open HEC-HMS by clicking on the HMS Icon from the top Toolbar. Within HEC-HMS, select the Tools | Program Settings menu. Then go to the Messages tab to edit how notes, warnings, and errors are displayed.
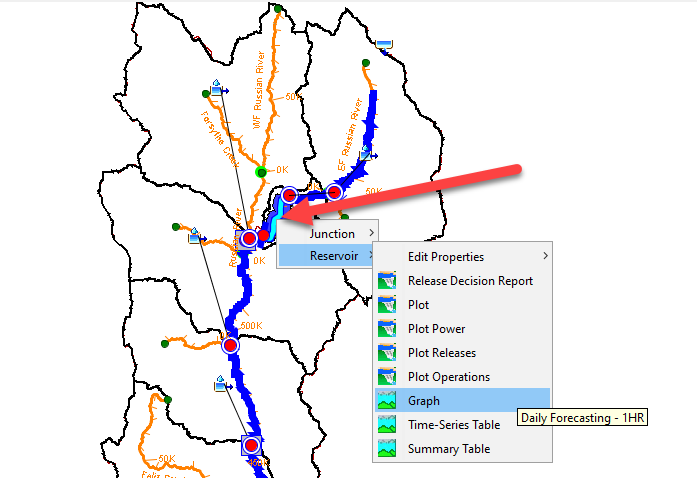
- From the CAVI, Zoom in to Coyote Lake (Lake Mendocino), right click the mouse when the curser is on top of the reservoir, and choose to view the Graph for the HEC-HMS reservoir element.
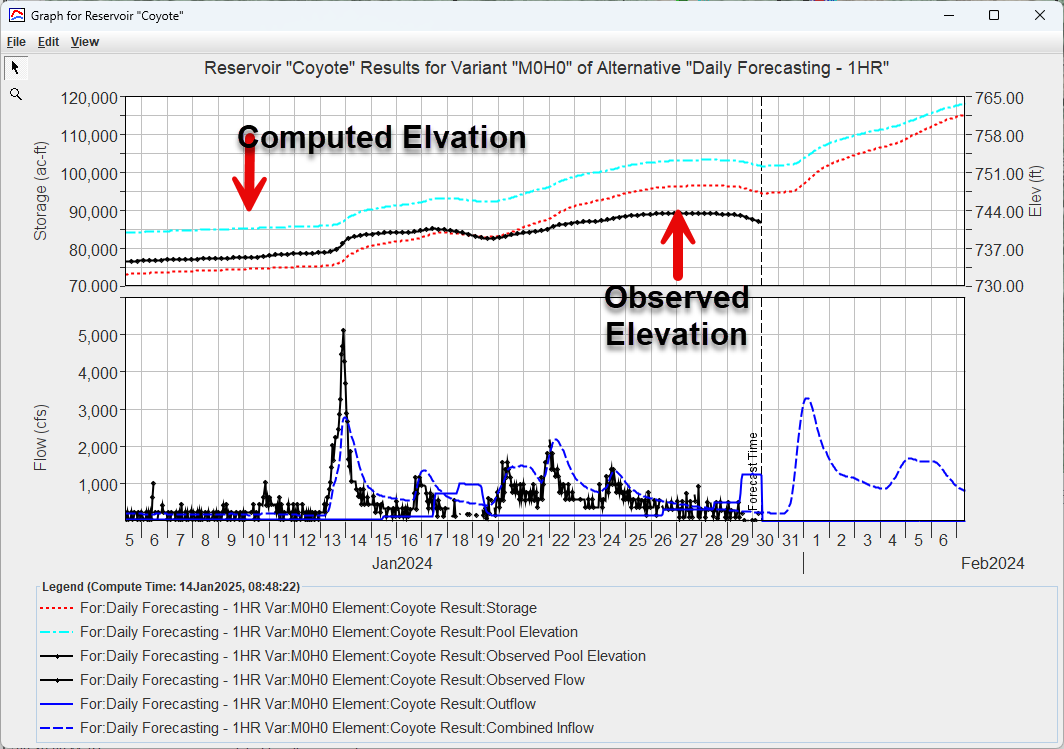
- Notice the model does a poor job simulating inflow and reservoir storage/elevation. This is due to a number of issues, including incorrect initial reservoir storage and poor simulation of inflow into the reservoir.
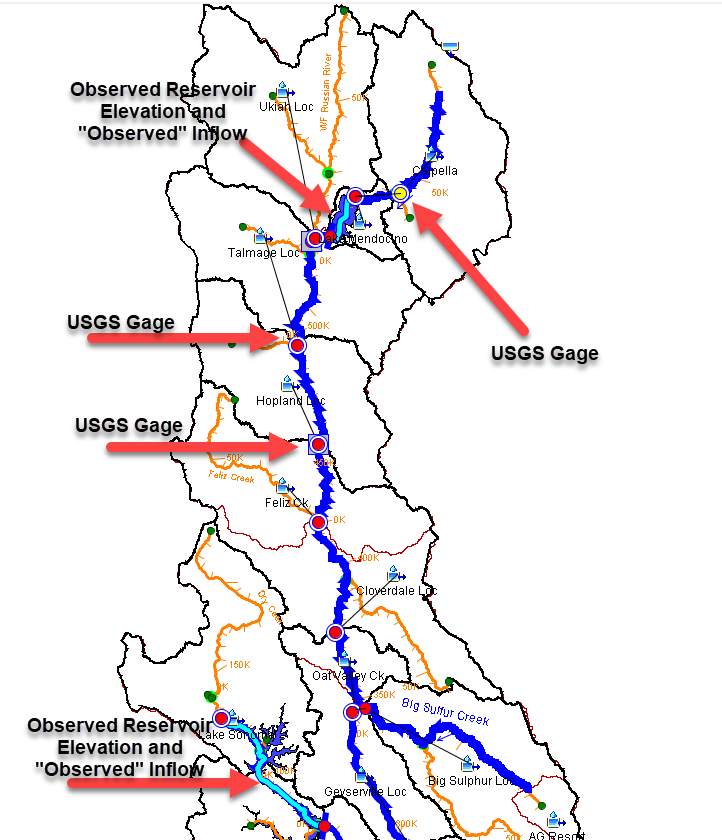
- The following figure shows five locations with observed flow/elevation that will be used to calibrate a portion of the model. The "observed" reservoir inflow was back computed using observed reservoir elevation and reservoir discharge. Take a minute and Plot HEC-HMS results at all five locations.
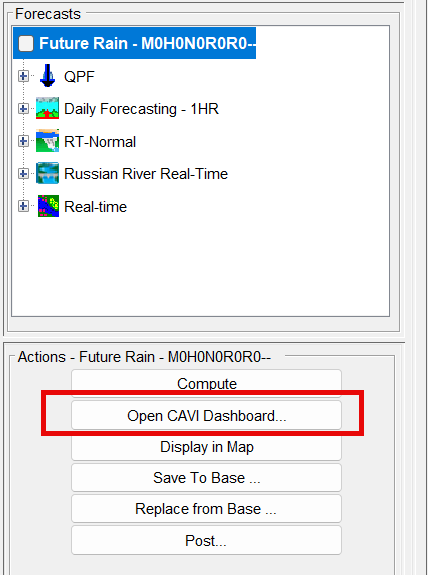
- A CAVI Dashboard configuration was created, named Calibration Example, and plots were added for the five locations shown above. You can use the dashboard to quickly access plots from key locations without opening the plots from the CAVI map. The figure below shows where to open the CAVI Dashboard tool.
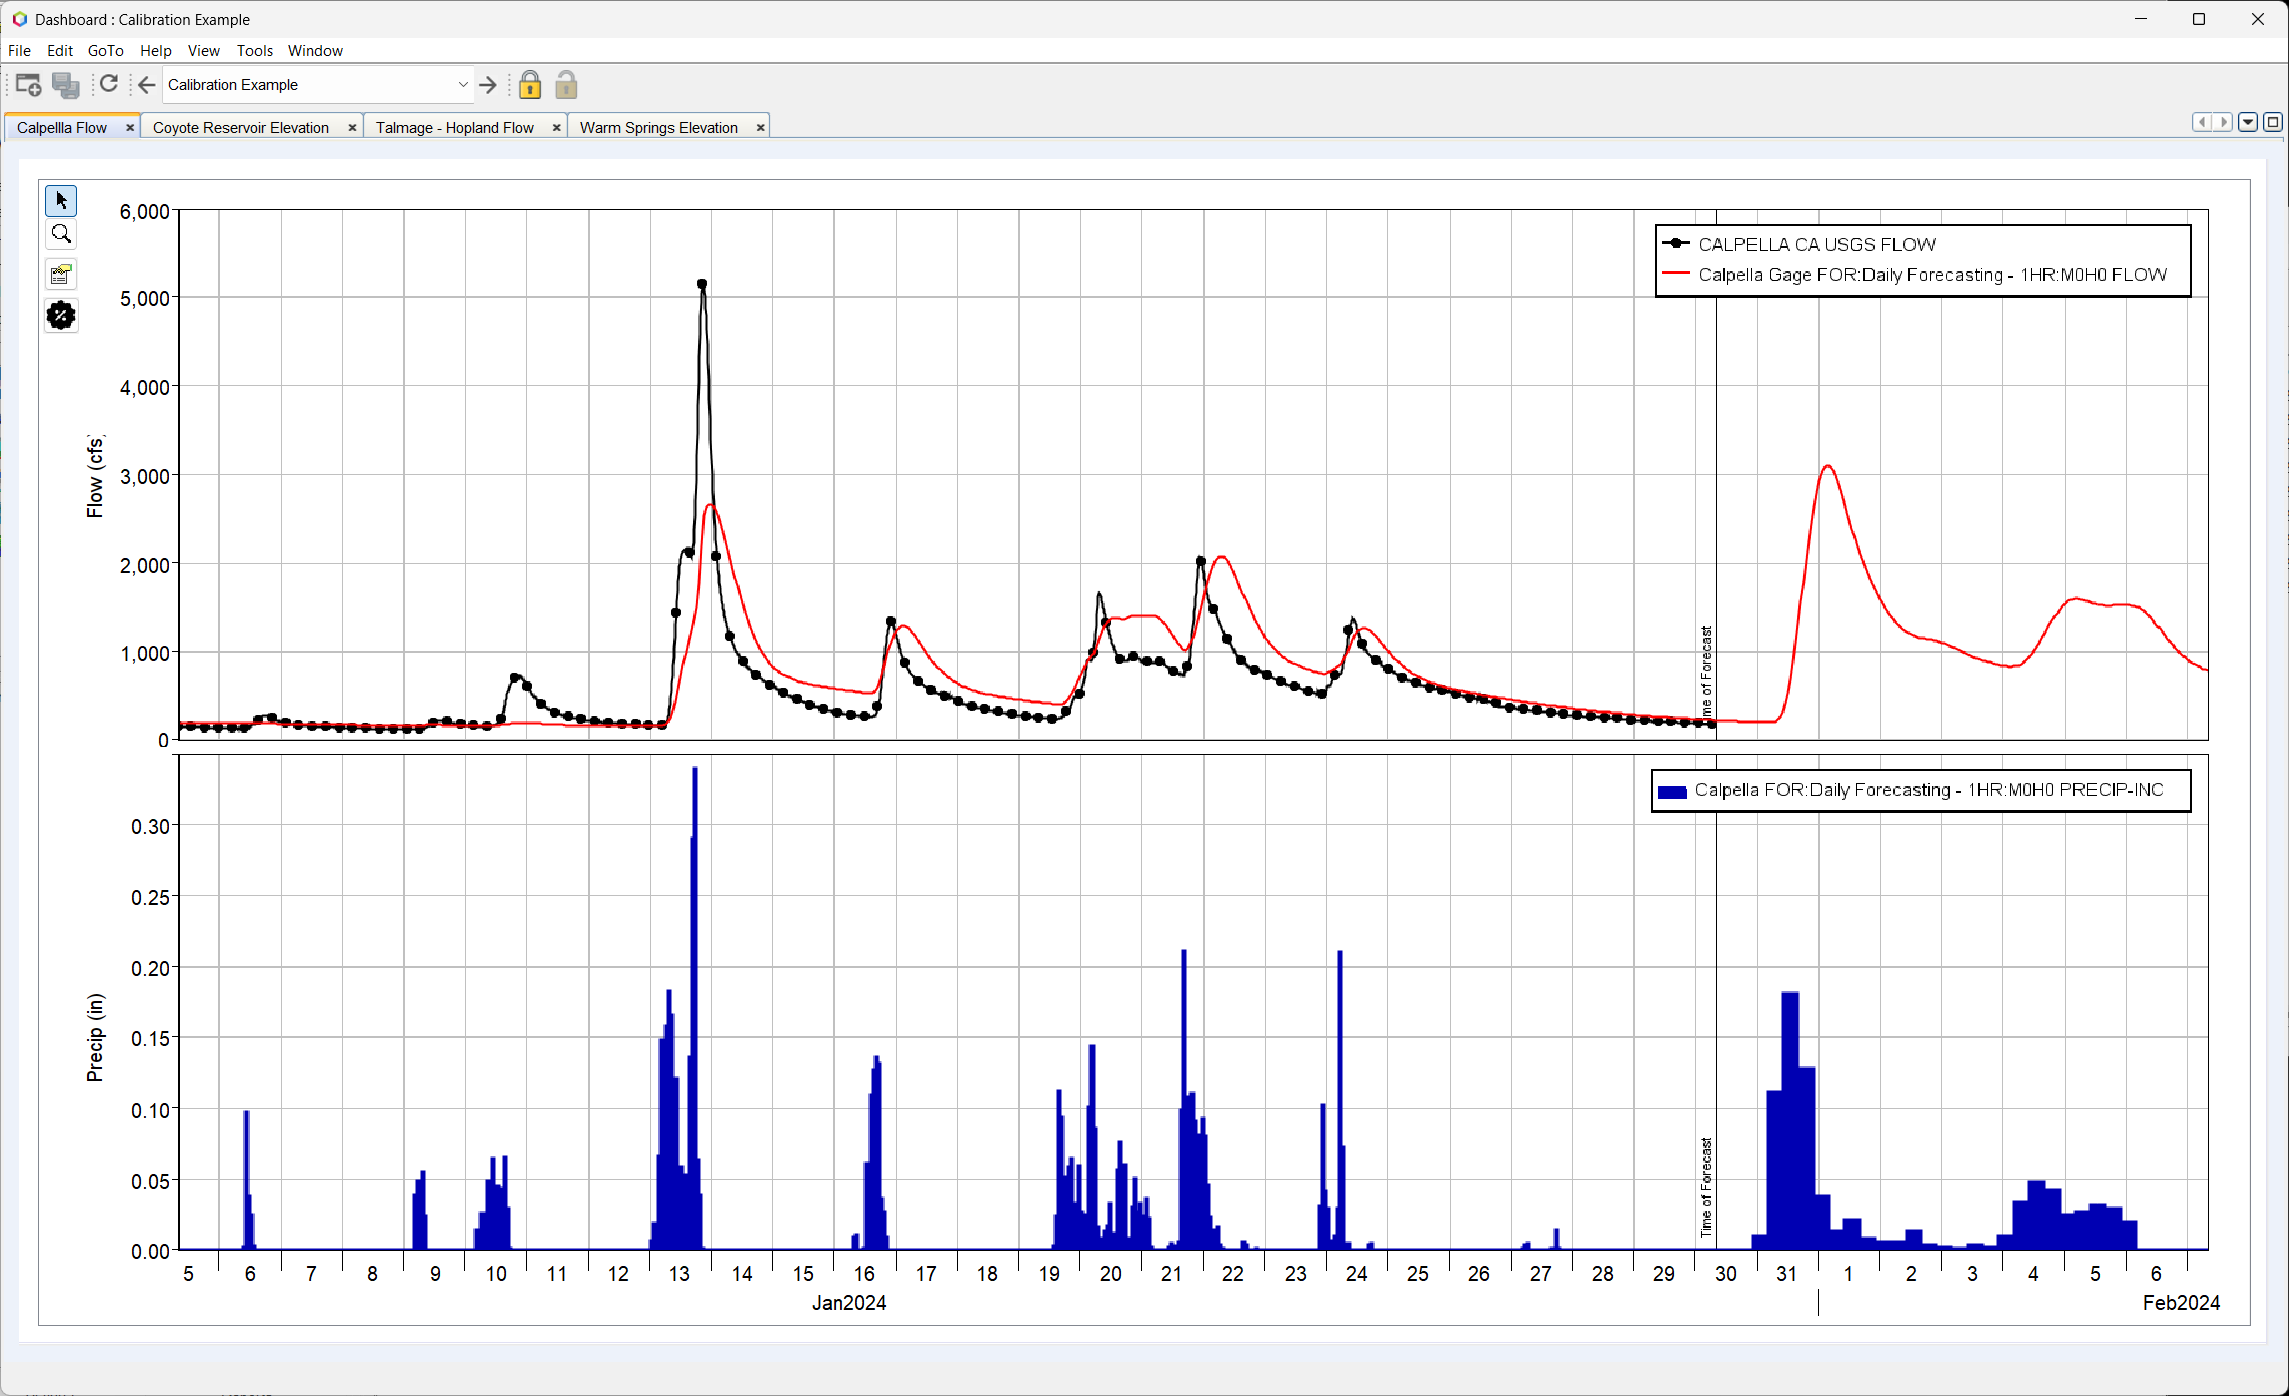
- You should see four tabs in the Calibration Example dashboard configuration, as shown below. The plots were configured to reference HEC-HMS results in the output DSS file. You should notice that the plots update each time you change HEC-HMS model parameters and re-run the forecast alternative.
- Open the Summary Table for the Calpella Gage junction and Hopland Gage junction and answer the following two questions.
What is the Percent Bias at the Calpella Gage junction element? This junction is located upstream of Lake Mendocino, the first USGS gage location in the figure above.
16.72 %
The Nash-Sutcliffe metric is helpful for identifying how well the model performs. A Nash-Sutcliffe of 1 means the model is able to perfectly match observations. Generally, a value greater than 0.7 means the model performance is good. Your goal is to have a Nash-Sutcliffe metric close to 1.
What is the Nash-Sutcliffe metric for the Hopland Gage junction?
0.33
Prior Task(s):
Current Task: