Task 2: Running a Forecast with HEC-RAS
In this portion of the workshop you will be opening a forecast, creating a static depth map in HEC-RAS Mapper, running the forecast, and viewing the results in HEC-RAS and HEC-RAS Mapper.
Opening the Forecast
Now that you have configured HEC-RAS Mapper, you need to open the forecast before you can run the models.
- From the Modeling module in the CAVI, select Open from the Forecast menu.
- Open the HEC-RAS in CWMS Forecast.
- It has time time window below, and both Future Rain and No Future Rain Forecast Runs selected.
Forecast Time: 04Jan2017 at 1000
Extract Start: 01Jan2017 at 1000
Start Time: 01Jan2017 at 1000
End Time: 11Jan2017 at 1000
- It has time time window below, and both Future Rain and No Future Rain Forecast Runs selected.
- Notice that both forecasts have already been run through the HEC-ResSim alternatives.
Creating a Static Map
Before viewing the forecast results, we will create a static (saved to disc) depth grid for the RAS Alternative (N0H0N0R0). This depth grid is a .tif format grid that can be used to view HEC-RAS results in other applications (ArcGIS, Google Earth, etc.) and is required as input for HEC-FIA.
- From the Modeling tab, open HEC-RAS.
- Launch HEC-RAS Mapper.
- Notice that other static maps have already been created (Arrival Time and D*V).

- Right-click on the N0H0N0R0 layer under Results in the layer tree and select Create a New Results Map Layer.

- From the Results Map Parameters dialog, select Depth from the Map Type options, Maximum from the Unsteady Profile options, and Raster based on Terrain under the Stored (saved to disk) options. See the image below for reference.

- Click Add Map to create the new layer, then Close to exit the dialog.
- You will now see a new layer under the RT Unsteady results named Depth (Max). It will be different than the pre-loaded results layers, as it will have a save icon next to the name indicating this file will be saved to disk rather than saved in memory.

- Notice the red asterisk next to each of the static maps. This is because we haven't run the HEC-RAS alternative yet, and the maps do not exist yet.
- Save HEC-RAS Mapper and Exit.
- Save HEC-RAS and Exit.
Preparing the Observed Data
- Click on the Scripts tab and run the Stage2Elev script. This script will convert observed stages to elevations by adding the gage datums to the observed data time series. This allows us to compare the observed water surface elevations to the computed water surface elevations from HEC-RAS.
- Once the script runs successfully, you should see the following dialog:
- Once the script runs successfully, you should see the following dialog:
- Click OK.
Computing a Forecast Run
There are two different forecast runs within the forecast. The No Future Rain run has an HEC-MetVue alternative that only includes observed precipitation. The Future Rain run has an HEC-MetVue alternative that includes observed and forecasted precipitation. All other model alternatives are identical (HEC-HMS, HEC-ResSim, and HEC-RAS).
Can you think of reasons why you may want to have forecast runs with different model alternatives?
You may need different model alternatives to allow for different inputs or model variables/setups, for instance:
HEC-MetVue: NWS gridded precipitation vs. Interpolated Grids from precipitation gages
HEC-HMS: snowmelt vs. no snowmelt
HEC-ResSim: HEC-HMS inflows vs. NWS inflows
HEC-RAS: 1-D model geometry vs. 2-D model geometry
Now, compute the HEC-RAS Alternative to view the results.
- Right-click on the No Future Rain forecast run and select Compute.
- Once the forecast run is successful, you should see something similar in the Compute Progress dialog.

- Click Close to close the dialog.
- Once the forecast run is successful, you should see something similar in the Compute Progress dialog.
Viewing Results in HEC-RAS
You can view the model results in the Map Window if you wish (right-click on a model element and select an appropriate option from the shortcut menu). For this exercise, you will be opening the HEC-RAS model to compare the results to observed gage data instead of viewing the results from within the CAVI.
- From the Modeling module, click on the HEC-RAS icon from the Main Toolbar. This will open the HEC-RAS model that was copied into the forecast directory when the forecast was created.
- You can verify that we are accessing the correct model by checking the file pathnames in the main HEC-RAS window.

- You can verify that we are accessing the correct model by checking the file pathnames in the main HEC-RAS window.
- There are many ways to view results in HEC-RAS, including Profile Plots, Cross Section Plots, Rating Curve Plots, and Hydrograph Plots. For this exercise, you will be reviewing the results using the Hydrograph Plots. If time allows, you can use some of the other options to view the results in HEC-RAS.
- Click on the Plot Stage and Flow Hydrographs button from the main HEC-RAS window.

- Navigate to the Hopland location to compare the observed stage and flow hydrographs with the computed HEC-RAS results.
River: Russian
Reach: CoyotoeToDC
River Sta: 84.61 Hopland (OBS)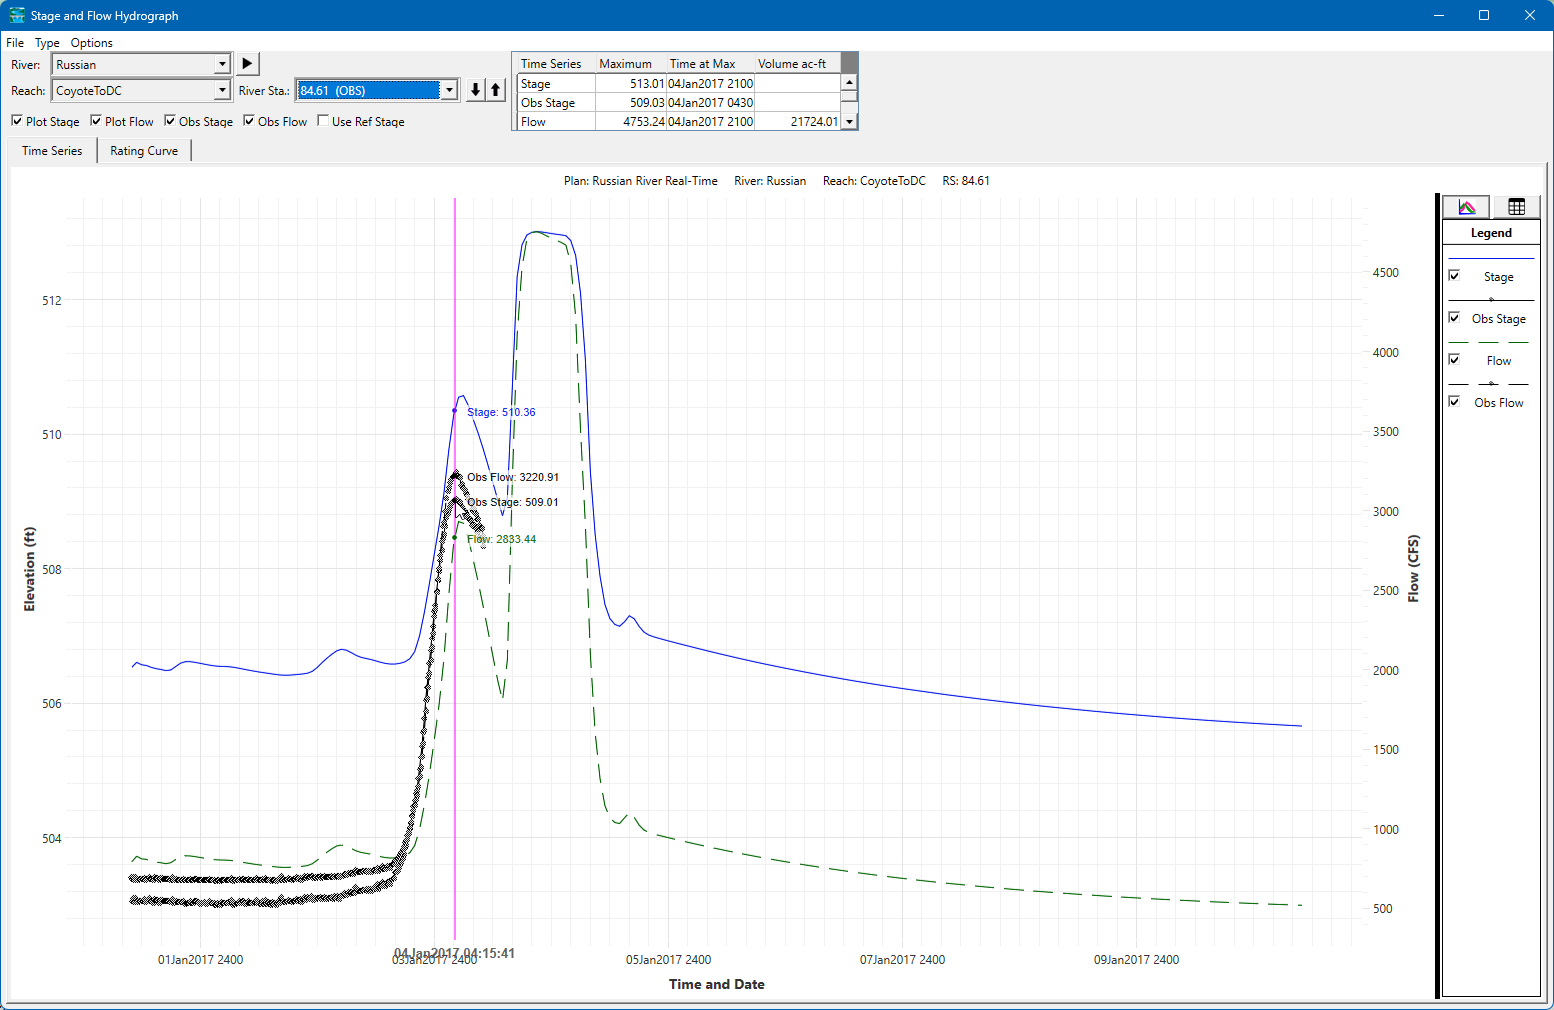
- You can toggle on/off the observed and computed stage or flow (view only stage first, then view only flow) to get a better idea of how the model results compare to the observed data during this time period.
How do the results compare? Can you think of some reasons why the model results are not matching the observed data for this location?The computed stage and flow peaks are lower than the observed data from the USGS gage at Hopland. The computed peak stage (prior to the time of forecast) is approximately 510.5 feet, whereas the observed peak stage is approximately 509 feet. The computed peak flow (prior to the time of forecast) is approximately 2,800 cfs, whereas the observed peak flow is approximately 3,235 cfs.
There could be several reasons why the model results do not match up very well with the observed gage data at this location. The HEC-HMS model may not be calibrated, or the meteorologic data used by the HEC-HMS model is not accurate, so the inflows to the HEC-RAS model may be off. We assumed that the input data to the HEC-RAS model was sufficient (i.e. calibrated) for this workshop, but that may not be the case. The calibration of the HEC-RAS model may be insufficient, and therefore the model parameters need adjustments to make the computed results match more closely to the observed data.
- You can toggle on/off the observed and computed stage or flow (view only stage first, then view only flow) to get a better idea of how the model results compare to the observed data during this time period.
- Navigate to other locations with observed data - look for the locations with (OBS) in the River Sta. drop-down menu. How do the results look in other locations? Are you happy with the results or do you think the model needs to be calibrated?
Calibrating the HEC-RAS Model
Try to calibrate the model so that our results at Hopland better align with the observed gage records.
- Open the Geometric Data editor from the main HEC-RAS window. Select the Manning's n or k values (Horizontally varied) option from the Tables menu.
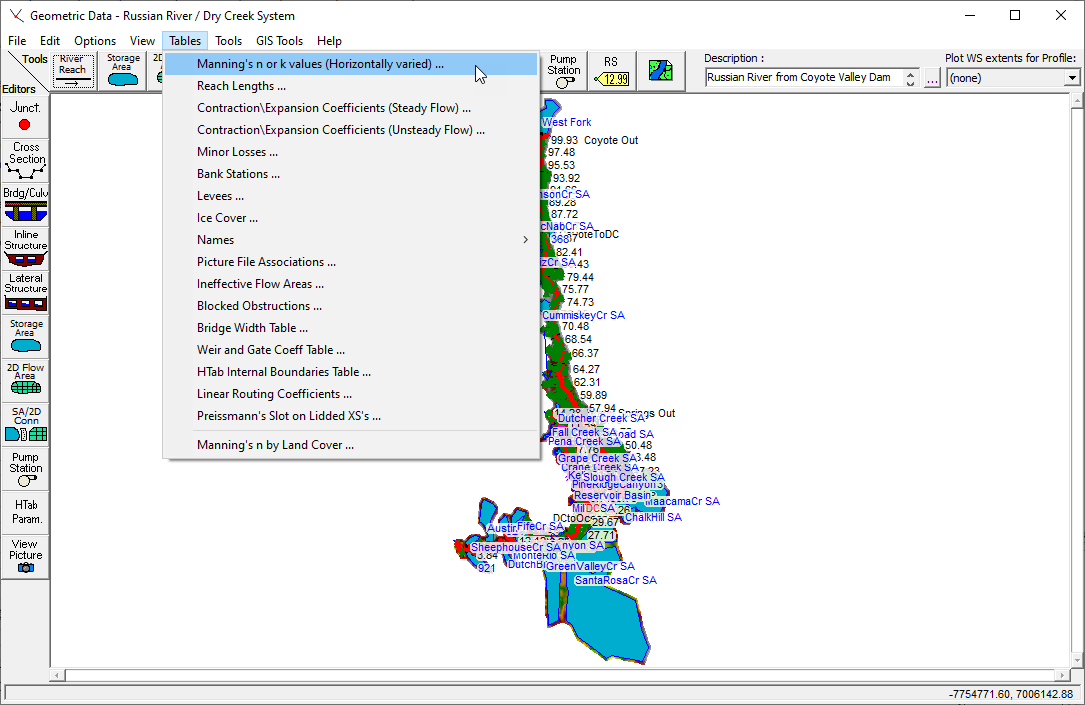
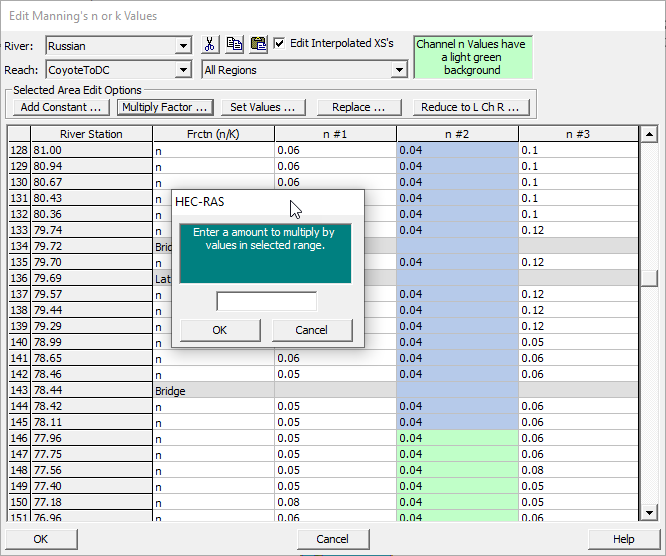
- Adjust the channel n-values (highlighted in light green background) between River Station 91.97 and 78.11 (River: Russian / Reach: CoyoteToDC). You can select all of the cells and click on the Multiply Factor button to adjust all values at once.
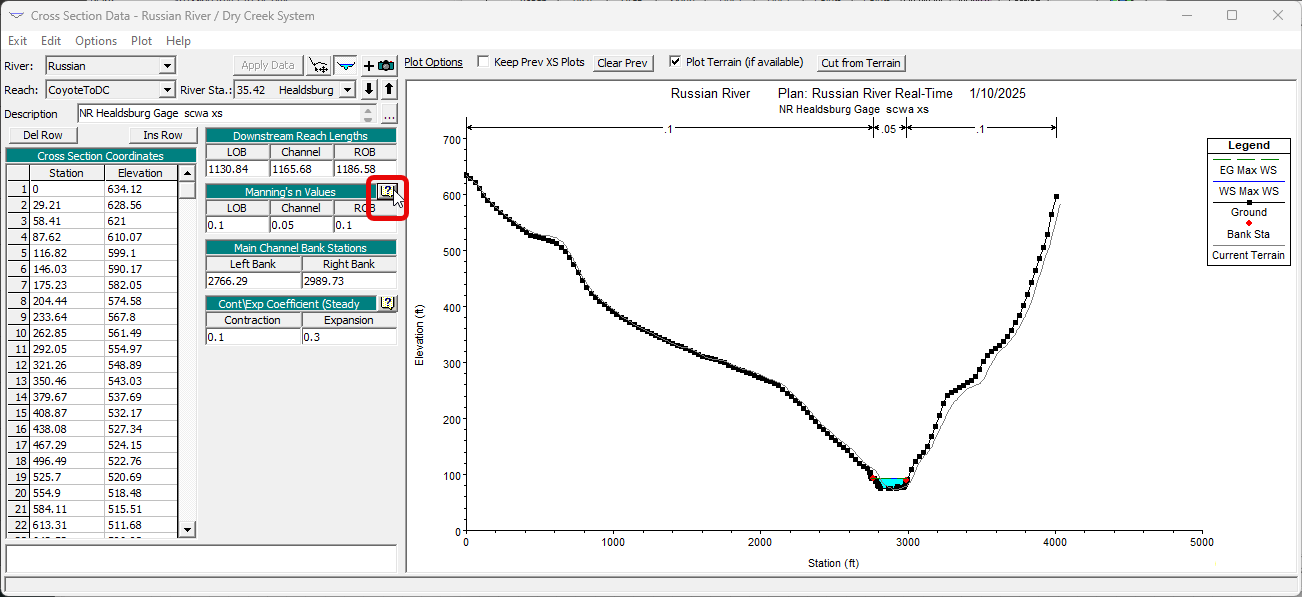
Energy Loss Coefficients
Reference Material for Energy Loss Coefficients can be found here: https://www.hec.usace.army.mil/confluence/rasdocs/ras1dtechref/latest/basic-data-requirements/geometric-data/energy-loss-coefficients
This page can also be reached directly from the Cross Section Data Editor within HEC-RAS.
- Click OK to exit the table. Save your geometry file and Save your HEC-RAS model.
- From the Unsteady Flow Analysis dialog, click Compute.
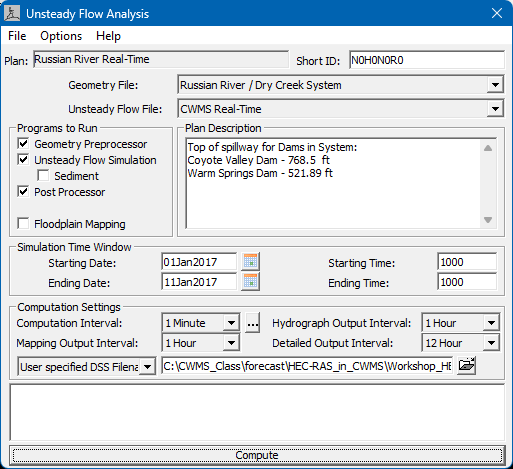
- You can also return to the CAVI and right-click on the HEC-RAS alternative and select Compute from the shortcut menu. If you hold down the Ctrl key and then click Compute, it will force a recompute of the model alternative.
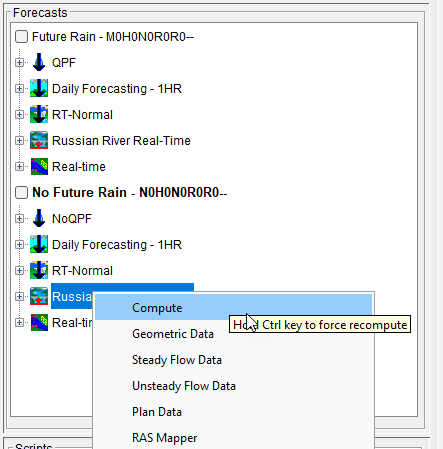
- You can also return to the CAVI and right-click on the HEC-RAS alternative and select Compute from the shortcut menu. If you hold down the Ctrl key and then click Compute, it will force a recompute of the model alternative.
- Once the model has computed successfully, review the results at Hopland using the Stage and Flow Hydrograph plots. Repeat the process a few times: modify the Manning's n values, run the HEC-RAS model, and review the results at Hopland. You can consider calibration of this section of the model complete once you have the computed peak stage within 0.5 feet of the observed peak stage.
How did you modify the 'n-values' to calibrate the model? Did you have to increase or decrease them to get the model results to better match the observed data?
You should have decreased the 'n-values' to calibrate the model, as the original peak stages were higher than the observed data. Decreasing 'n-values' will decrease the water surface elevations in the region of the model you are calibrating.
What difficulties might you encounter when calibrating a HEC-RAS model in a CWMS forecast?
One difficulty you may experience during calibration is that you must calibrate to both the timing and magnitude of flows as well as the resulting elevations at gage locations. Balancing the calibration of both flow and elevation can be difficult.
Typically the HEC-RAS modeler has to take whatever output is generated by the HEC-HMS and HEC-ResSim models and use it as is. Depending on the quality of calibration of those models, calibration could be difficult for the HEC-RAS modeler.
If you have additional time, continue calibrating downstream of Hopland.
Prior Task(s):
Current Task:
Next Task(s):