Download PDF
Download page Creating an HEC-MetVue Model Alternative.
Creating an HEC-MetVue Model Alternative
HEC-MetVue Project File and Directory Structure
Settings within a HEC-MetVue Project file provide the base information for developing HEC-MetVue Model Alternatives in the. HEC-MetVue Project files follow the hierarchy Project > Sessions > Map Panels. Projects contain global settings. Sessions are synonymous with Model Alternatives in the context of the CAVI (i.e. any Session in the Project file is also a Model Alternative in the Setup Module of the CAVI). Map Panels house settings for the Input Data and Basin Average Maps.
Each watershed has a single HEC-MetVue Project, which contains one or more Sessions (each corresponding to a CAVI Model Alternative). Each Session should contain at least one Map Panel, and the Map Panels within the Session will perform the data processing functions necessary for a forecast run. Since HEC-MetVue is a hydrometeorological data processor, it will likely need to process data for the Lookback and Forecast time windows separately. Therefore, creation of a Lookback and a Forecast Map Panel for each dataset will likely be required. After creation of these Map Panels, each should be loaded with input data that matches the data extract, and any necessary basin average maps added.
If not already present in the Watershed directory, HEC-MetVue will create the directory ./watershed/MetVue to house its settings when opening a Watershed. Additionally, a Project file matching the Watershed’s name will be created and opened, and a maps sub-directory will be created to house the basin average maps. The ./watershed/MetVue directory will also contain the HEC-MetVue Model Alternative files once they are created (with the .mvalt extension), which contains information about input file/paths, and output data to create.
For an example on setting up an HEC-MetVue Project using in the CAVI, see Creating an HEC-MetVue Project.
Importing Existing HEC-MetVue Project
Importing of existing Project files may be performed if the user has a pre-built project file with all the desired settings. During the import, each Session within the Project File will be converted into a Model Alternative. Through this process, the Project file will be copied into the ./watershed/MetVue directory with a file name matching the watershed. All basin average maps will be copied into the ./watershed/MetVue/maps directory, and all map files will become relatively pathed within the Project File. This will make the maps available for computes within the CAVI. Although maps are copied into the watershed directory, no HEC-MetVue data is copied. Copying of HEC-MetVue data is avoided because it is potentially very large, and will likely be replaced through the extract process. Finally, a HEC-MetVue Model Alternative file will be created (with the .mvalt extension) for each Session within the Project file. Within each Model Alternative file, each Map Panel in the corresponding Session will have an input data type and input file/path, which is parsed from the settings in the Project file.
To import a MetVue Project File:
- Select the MetVue icon in the Setup module by right-clicking on it and selecting Import. This will bring up the Open MetVue Project File dialog.
- Select the Project file you would like to import and click Open.
Creating Model Alternatives
HEC-MetVue supports the addition and deletion of Sessions and Map Panels in the watershed’s Project file. This allows for development of Model Alternatives within the automatically generated or imported Project file. This can be performed by launching the HEC-MetVue application in the CAVI (rain drop button on the Main Toolbar), then performing the necessary edits in the project tree. Once you have completed the necessary edits, close HEC-MetVue. Clicking on the HEC-MetVue node in the Setup module will refresh the Sessions and Map Panels. If Sessions were added, those will show up as new Model Alternatives. If Map Panels were added, those will show up in the MetVue Alternative Editor for the given Model Alternative. Similar to the Import process, a Model Alternative file will be created for each Session created in the Project file, and that Model Alternative file will contain the input data type and input file/path information. As opposed to the Import process, the basin average maps will not be copied, and therefore it is recommended that all basin average maps are placed in the ./watershed/MetVue/maps directory, and relative pathing turned on.
Editing HEC-MetVue Model Alternatives
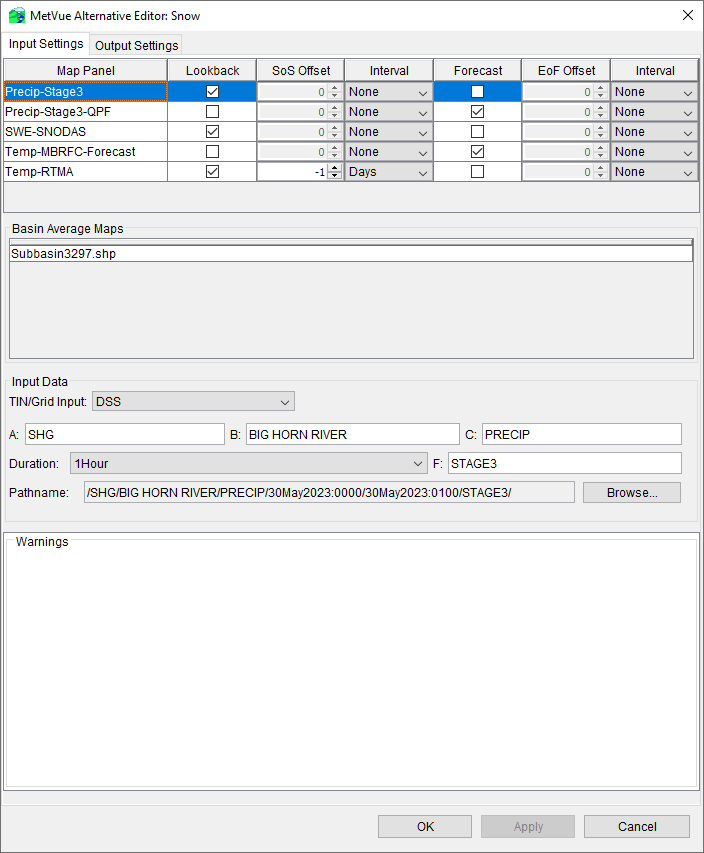
HEC-MetVue Model Alternatives can be edited by right-clicking on the alternative node and selecting Edit Alternative. The MetVue Alternative Editor dialog will open. The editor has two tabs, Input Settings and Output settings.
Input Settings
The Input Settings tab identifies the Map Panels that will be used in the Forecast. In each row of the table, the user can specify if a Map Panel applies to the Lookback, Forecast, or both time windows, which controls the time window that the Map Panel is asked to load data within the Modeling tab. These are selected with the checkboxes in the table. Each Map Panel that will be used in a forecast must have at least one time window selected.

The Basin Average Maps are used for computing basin average time series, and are reported in this editor. Editing the basin average maps must be performed on each Map Panel in the HEC-MetVue application. Changes to the Basin Average Maps performed in the HEC-MetVue application will be appear in the MetVue Alternative Editor after closing and reopening the editor. When the mouse pointer is hovered over a row in this table, the absolute path of the basin average map file is presented for verification purposes.
The Input Data section allows you to select the type of TIN/Grid Input (i.e. HEC-DSS, File, or MetVue Interp), define selection criteria for the input type, and specify your interval. The three options are summarized below:
- DSS - Selecting the HEC-DSS option allows you to see the pathname selection fields. These fields may be populated by manually entering text, or clicking the Browse button and selecting a record in an existing HEC-DSS file. These settings will be used to select the pathname from the forecast.dss file based on the A, B, C, and F part, and the input duration.
- File - Selecting the File option allows you to select input files based on filename patterns and duration filtering.
- MetVue Interp - Selecting the MetVue Interp option allows specification of a MetVue Interp file (similar to Gage Interp). This allows you to specify the input data from point time series, which will then be interpolated onto a grid.
The TIN/Grid Input will be filled automatically with the MetVue Map Panel read settings during the import process, but may require additional editing if the read settings are incomplete/incorrect. It is important to verify that each Map Panel TIN/Grid Input matches the desired input data source. Additionally, any HEC-DSS paths are assumed to be located in the forecast.dss file once a forecast is created. The File and MetVue Interp options should be relatively pathed to ensure proper loading when in the forecast module.
Output Settings
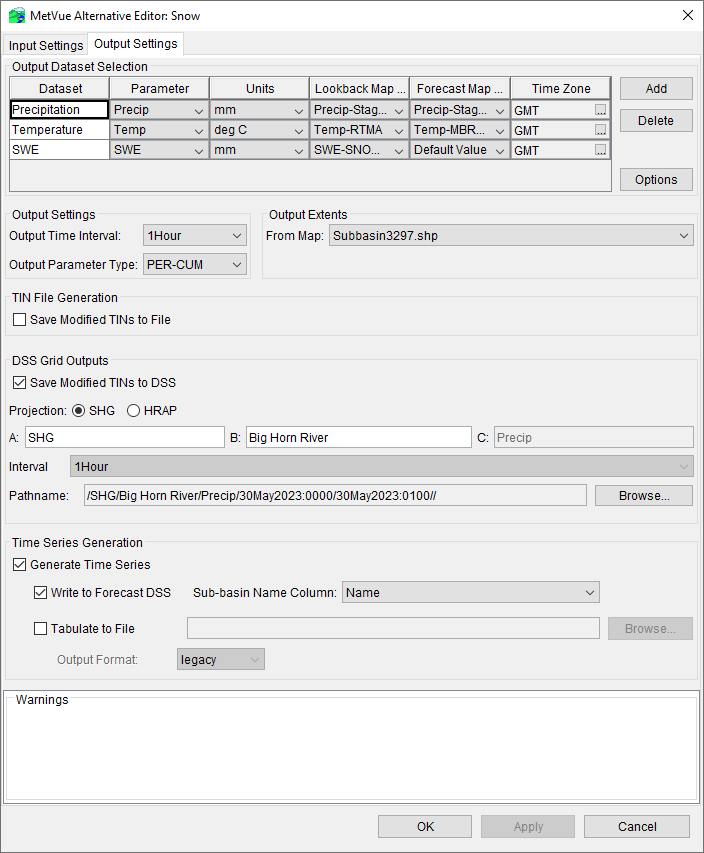
The Output Settings tab in the MetVue Alternative Editor contains sections to specify the output datasets, including the output dataset name, output time interval, and three possible output data types: Gridded Data File Generation, DSS Grid Outputs, and Time Series Generation.

The Output Data Selection table is located at the top of the Output Settings tab. This allows you to identify an output dataset and assign the Map Panels that will provide the lookback and forecast input data. The Lookback Map Panel column will be populated with the Map Panels specified for the lookback time window in the input settings, and the Forecast Map Panel column will be populated with the Map Panels specified for the forecast time window in the input settings. If a single Map Panel will be used for both the lookback and forecast, then that Map Panel needs to have both time windows selected in the Input Settings tab. Each dataset needs to have a Name, Parameter and Unit specified. This determines how the output metadata will be written.
The Output Time Interval is used to specify the time interval that the downstream model requires. As shown in the example above, MetVue will generate a 1-Hour dataset. If the input and output time intervals do not match, HEC-MetVue will aggregate/disaggregate/interpolate data from the input time interval to the output time interval. Additionally, the Output Parameter Type may be altered. This will most like be PER-CUM for precipitation, and PER-AVG (for daily average) or INST-VAL (for sub-daily measurements) for temperature.
It is important to distinguish between Input Duration and Output Time Interval settings. In the Input Settings tab, with DSS as the selected input, records are filtered based on duration. Duration is the timespan of an individual grid ([end time]-[start time]). Alternatively, the Output Time Interval is the time difference between successive grids ([second grid start time]-[first grid start time]). For example, an input instantaneous temperature grid will have a duration of zero, but an output instantaneous temperature grid will have an interval greater than zero (i.e. 1Hour). In the case of non-instantaneous data (i.e. precipitation), the duration and interval will both be non-zero. In most cases, non-instantaneous grids will have an interval that equals its duration.
The Output Extents panel allows for defining the spatial extents of the output data, based on a shapefile. This ensures that HEC-MetVue is not creating unnecessarily large grids.
The three types of output data – Gridded Data File Generation, DSS Grid Outputs, and Time Series Generation – can be specified. While all three types of output data may be generated in a single forecast run, it is advised that you only select necessary data. This is because each output data type requires additional computation time and space within the forecast.dss file.
- Gridded Data File Generation - allows for the specification of saving projected data to any gridded file output supported by HEC-MetVue. This option requires specification of the Write Provider, the projection of the output grid, and the output filename. Custom projection information can also be specified via the Add/Edit button.
- DSS Grid Outputs - allows the user to specify the record pathname to save the output data into, and these records will be saved into the forecast.dss file. These settings also allow the user to specify whether the output should be in the SHG or HRAP projection.
- Time Series Generation -allows the user to specify if basin-average time series will be generated, and allows for selection of the Sub-basin Name Column within the shapefiles, which is required for identifying the output pathname.
For most applications, it is expected that either HEC-DSS Grid Outputs or Time Series Generation will be used, so that the data can be passed to HEC-HMS. For Time Series Generation, the default selection is “Name” for the Sub-Basin Name Column combo-box. That is the column in the shapefile that is expected to correspond to the HEC-HMS sub-basin name. If using Time Series Generation for a watershed in a Time Zone other than GMT, refer to Important HEC-MetVue Application Settings below for additional considerations.
If there are any errors with the setup in this panel, the Warnings text box located at the bottom of the tab will contain notifications about what you need to change.

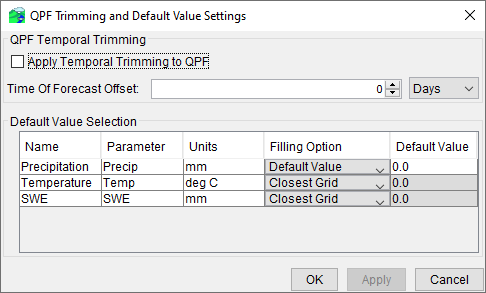
The QPF Trimming and Default Value Settings dialog allows for controlling QPF trimming and data filling options. QPF trimming provides the ability to set forecast precipitation to zero, beyond a given lead time. Data filling for each output dataset is controlled in the Default Value Selection table, where each output dataset can be set to No Filling, Default Value or Closest Grid. No Filling leaves missing grids as missing, Default Value creates an entire grid filled uniformly with the user-specified default value, and Closest Grid duplicates the closest available grid in time.