Time Series Icons Layer Properties
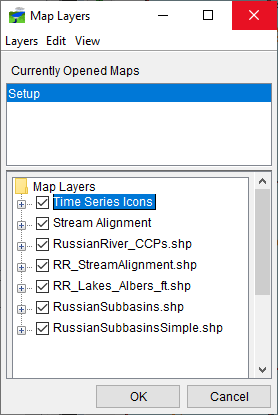
You can configure the appearance of a time series icons layer's time series icons and their labels (Global Properties), set the visualization scale (Scale), and associate a template (Template) from the Time Series Icon Layer Properties dialog (Figure 1). From CWMS, there are two ways to access the Time Series Icon Layer Properties dialog. From the CWMS CAVI main window, click on the Setup tab, from the Maps menu, click Map Layers. The Map Layers dialog will open. From the Map Layers tree, right-click on the Time Series Icons layer. From the shortcut menu, click Properties, the Time Series Icon Layer Properties dialog will open (Figure 1).
Another way to access the Time Series Icon Layer Properties dialog, is from the Time Series Icon Editor, click on the Icon Types and Layers tab. From the Layers box, right-click on a time series icons layer, from the shortcut menu, click Properties, the Time Series Icon Layer Properties dialog will open (Figure 1).

Global Properties
The Global Properties Tab (Figure 1) allows you to change the appearance of time series icons and their labels for the time series icons layer that has been selected in the Layer list (Figure 1) for only the Acquisition and Visualization modules. Time series icons that have been selected for the Modeling and Setup modules are not affected by changes to Global Properties. There are several ways to control the appearance of time series icon labels:
- Select a time series icons layer, by default, the time series icons display using the Medium Icon (Figure 1) format. From the Icons box, you have five options for displaying time series icons – Small Graphic, Small Icon, Medium Icon, Large Icon, and Custom.
- By default, the labels for time series icons display, if you do not want the labels for a specific layer to display, clear Draw Names (Figure 1). Click Apply, for the selected time series icons layer, the time series icon labels will no longer display.
- To change the color of a time series icon's labels, click Foreground Color. A Color Chooser opens (Figure 2), from this chooser you can select the color you want the labels to display in. Click OK, and the Color Chooser closes. Click Apply, for the selected time series icons layer, the time series icon labels will display in the color. For more information see Color Chooser.

- By default, time series icon labels do not have a background color, if you want a time series icon label to have a background color, click Draw Background (Figure 1) and click Apply. For the selected time series icons layer, the time series icon labels will now display with a background color (light gray). You can change the background color by clicking Background Color (Figure 1). The Color Chooser will open (Figure 2), select the color you want the background of the time series icon labels to display in, and click OK. The Color Chooser will close, click Apply. For the selected time series icons layer, the time series icon labels will now display with a background color in the color you choose.
- When a module's Map Window displays the whole watershed, some time series icon labels will not display when the time series icons overlap other elements. To display a time series icon layer's labels, click Draw Overlapping Names (Figure 1), and click Apply. For the selected time series icons layer, the time series icon labels will now display when viewing the whole watershed.
- To change the font of a time series icons layer's time series icon labels, click Name Font (Figure 1). A Font Chooser will open (Figure 3), where you can select the font type from the Font list (Figure 3), and you can select a size using the Size slider (Figure 3). In addition, you can select whether to have the font display in Bold and/or in Italic. Click OK, and the Font Chooser closes. From the Time Series Icon Layer Properties dialog (Figure 1), click Apply. For the selected time series icons layer, the time series icon labels will now display in the font and size you selected.

Scale
The Scale Tab (Figure 4) of the Time Series Icon Layer Properties dialog allows you to specify the map scale, or zoom level, at which a time series icon sub-layer becomes visible. By default, Always show layer is selected, which means the selected time series icons layer will always be displayed in the Map Window, regardless of the zoom level. However, you can select Only show layer in the following scale range, if you want to display the selected time series icons layer only when the Map Window scale is zoomed to the specified scale. You can specify scales below, above, or both, for when the selected time series icons layer will display time series ions. You can either enter the scale directly into the Only visible below 1 and/or Only visible above 1 or click Set to Current to set the scale equal for the current display.

Template
Templates are created to save customized plot settings that can be used by other plots and the time series icons layers. From the Template Tab (Figure 5) of the Time Series Icon Layer Properties dialog, you can associate a template with the Time Series Icons Layer by selecting a template from the Template list. In HEC-RTS, templates are created from plot windows.
