There are three main ways to view HEC-RAS model results in HEC-RTS:
- By right-clicking HEC-RAS elements in the map window
- Through the Reports tab in the Modeling module
- By opening HEC-RAS standalone
You can view a variety of simulation outputs, including Standard Output Tables, Rating Curve Plots, Profile Plots, and Hydrograph Plots, directly within HEC-RTS. The sections below describe how to access the most commonly used reports.
Viewing Results via the Map Window
When the Modeling module is active, the map window displays icons for each model element included in the forecast alternative (e.g., cross sections and reaches). To view results for a specific element, right-click the icon and select from the available display options.

Profile Plots
Profile Plots provide a useful overview of water surface elevations along a reach and are essential for checking model accuracy. If your simulation used unsteady flow, you can animate the profile. You can also zoom in on the water surface profile to examine results in detail.
Always review profile plots to check for unrealistic spikes or irregularities in the results. Investigate and correct any issues before finalizing your forecast.

Viewing Results via the Reports Tab
You can also access results from the Reports tab. In the Forecast Tree, select the specific HEC-RAS model element (e.g., cross section 14.28) and choose a report type from the Reports tab.

If you select the HEC-RAS model alternative (rather than a model element), additional report options will appear, such as Rating Curve plots and Stage & Flow Hydrograph plots.

Stage and Flow Hydrograph Plots
For unsteady flow simulations, Stage and Flow Hydrograph Plots show how water level and flow change over time at any output location in the model. If available, observed data will be displayed alongside the simulated results, allowing you to use these plots to evaluate the accuracy of your model.

Viewing Results in HEC-RAS Standalone
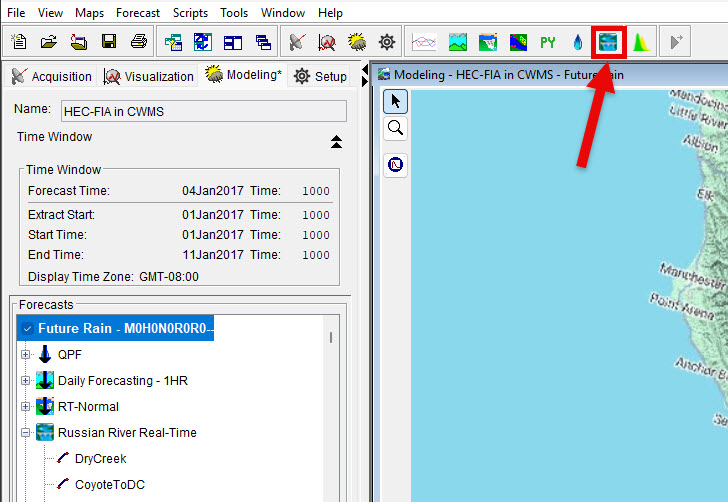
To access the full range of model outputs, open HEC-RAS standalone. Click the HEC-RAS icon in the toolbar (when the Modeling tab is active) to open the HEC-RAS project associated with the current forecast alternative.

Refer to the HEC-RAS User's Manual for additional information on viewing results.
Using HEC-RAS Mapper
HEC-RAS Mapper is a built-in GIS visualization tool that enhances spatial analysis and result interpretation. It is especially useful for viewing:
- Water surface elevation grids
- Flood depth grids
- Flood extent maps
- Time-series animations (for unsteady flow simulations)
To access HEC-RAS Mapper, launch HEC-RAS and click the HEC-RAS Mapper button.

For more detailed instructions, refer to the HEC-RAS Mapper User's Manual.