Download PDF
Download page Stochastic Storm Transposition in HEC-HMS.
Stochastic Storm Transposition in HEC-HMS
By: Gregory Karlovits, P.E., P.H., C.F.M
Stochastic Storm Transposition (SST), a data-driven method for development of watershed-averaged precipitation-frequency curves and flow-frequency curves, will be added to the HEC-HMS (Hydrologic Modeling System) software with the next release. SST is based on the same space-for-time substitution principle at the foundation of regional precipitation-frequency analyses, except instead of using annual maximum precipitation observations at gages, it uses the space-time patterns of observed storm events. Storm transposition has long been a technique used for estimating the properties of extreme rainfall, such as the probable maximum precipitation (PMP), by using the most severe storms within a homogeneous region and moving (transposing) them to the analysis watershed. SST generalizes this approach by incorporating a spectrum of storm severity instead of just the "worst-of-the-worst" as in PMP analysis. SST is being proposed as a solution for modeling fluvial (riverine) and pluvial (rainfall excess) flood hazards at any point within a watershed as part of FEMA's Future of Flood Risk Data (FFRD) initiative (FEMA's Future of Flood Risk Data Initiative). SST is an alternative to the current state of the practice, which models fluvial flood hazards using a set of probability-based storm events run through a hydrologic model to produce frequency flows that can be used to compute inundation. These storm events are developed using regional precipitation-frequency analysis data, usually published in a publicly-available nationwide atlas. No current procedure exists for estimating pluvial flood hazard.
Precipitation-frequency products in common usage provide estimates of point precipitation-frequency, as measured at precipitation gages. There are strengths and weaknesses to using these traditional products for developing flow-frequency curves. They are based on a regional analysis of long-record precipitation gages and have tens to hundreds of thousands of station-years of data. The probability models used for the depth-frequency relationship are based on robust statistics and sound theory, lending credibility to the quality of their estimates. Applying these products in a hydrologic model to get to flow-frequency requires a few additional assumptions that are not always correctly and consistently applied, or well-supported. Because these products are point-based, a means for estimating area-averaged precipitation depths from the point values is necessary to apply a frequency event. The depth-duration-frequency information provides storm total precipitation for a given duration but doesn't provide the distribution of rainfall in time or space, information that is necessary for hydrologic simulation.
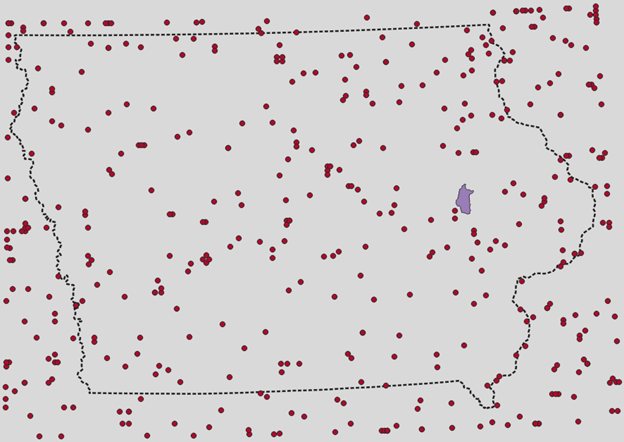
Modern SST is based on multi-sensor observations of past storms in a meteorologically-homogeneous region that are collected into a catalog of significant precipitation events. Radar-based precipitation data give insight into the spatial properties of precipitation events through time, and when combined with ground-based gage data and satellite rainfall estimates, produce high-quality measurements of precipitation. Until recently, high-resolution precipitation data with long periods of record have not been widely available. As these datasets become more common and higher in quality, SST becomes an increasingly attractive option for estimating precipitation-frequency or flow-frequency for a watershed. The storm catalog for a watershed contains the largest storm events of each year in the period of record, as measured by the precipitation accumulation over an area the size and shape of the target watershed. Typically, the 10 largest storms per year from the region are selected, based on the storm's largest 72-hour area-averaged precipitation when transposed over the watershed. A catalog example is shown below in Figure 1 for a small watershed in Iowa that treats the state as a homogeneous transposition domain. Each point is the center of the 440 storms in the catalog.
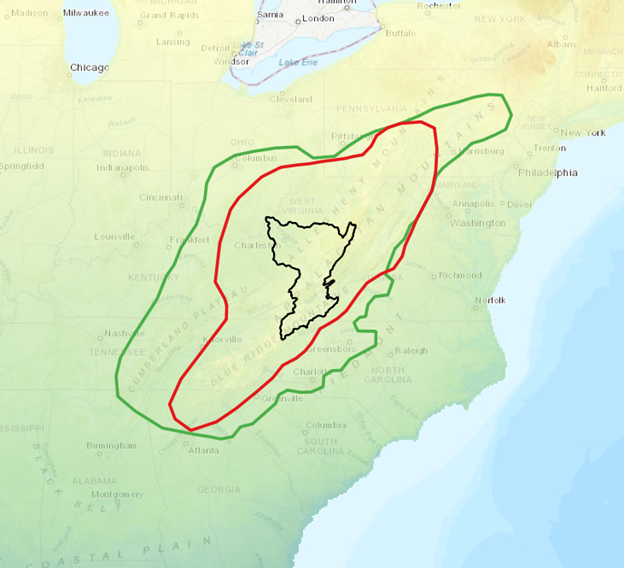
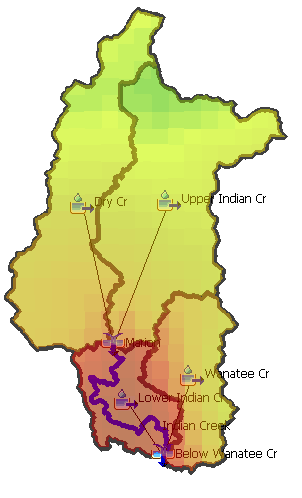
The foundational assumption of SST is that the transposition domain is meteorologically-homogeneous; that is, that a storm that occurs at one location within the boundary may be freely shifted to any other location within the domain. Establishing a transposition domain requires consideration for the types of precipitation events that can occur and their relative frequency, topographic influences, proximity to large bodies of water, and so on. For example, in a watershed where tropical storms can create heavy rainfall, the drawn transposition domain would need to establish a boundary where heavy tropical storm rainfall can occur with about equal probability. The process is subjective, and an area of active research is to develop an automated, data-driven method for drawing a domain for any watershed. An example of two plausible transposition domains for the Kanawha River watershed is shown below in Figure 2.
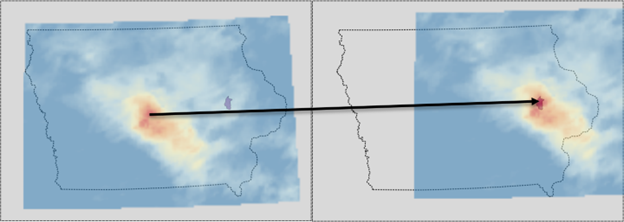
SST can be used to generate watershed-averaged precipitation frequency curves by selecting storms at random from the catalog, transposing them at random inside the transposition domain, and computing the watershed-averaged precipitation from each transposition. The structure of the simulation has more years than the rarest desired return interval. For example, if an estimate for the 1/1,000 AEP event is desired, the simulation will have more than 1,000 years of transpositions. Each simulation year contains multiple transpositions, and an empirical annual maximum distribution is extracted from the largest transposition of each year. The number of storms per year can vary, usually sampled from a Poisson distribution with a mean rate equal to the mean rate of storms per year in the storm catalog. Storms are altered by transposition only, and the fields are not rotated or scaled in any way. Transpositions vary according to a uniform distribution for both the x- and y-coordinate and restricted to the area of the transposition domain, resulting in equal chances of a transposition at any location in the domain. Shown below in Figure 3 is an example of the transposition of a storm event that results in widespread rainfall throughout the target watershed. This storm pattern has been shifted about 100 miles to the east and 15 miles to the north. This storm event is just one of 440 in the catalog, and the storm could have been repositioned anywhere in the transposition domain; the SST process can generate an enormous range of hypothetical realizations of past events.
For flow-frequency, the added step of running a hydrologic model is necessary. Each storm transposition requires a rainfall-runoff model to be initialized and run with the newly transposed precipitation. Peak discharge for each transposition is kept for every location in the watershed where a flow frequency curve is desired. Then, the annual maximum flow for each of those locations is collected into a flow frequency curve. The most important result of this kind of analysis is that the annual maximum flow is not assumed to occur for the entire watershed at the same time - different events and conditions can generate the annual maximum event for the different flow frequency locations. Below, in Figure 4, is a flow-frequency plot generated from HEC-HMS simulations of 1,000 years of storm transpositions for the demonstration watershed in Iowa and compared against the USGS StreamStats flow-frequency estimates for the same location.
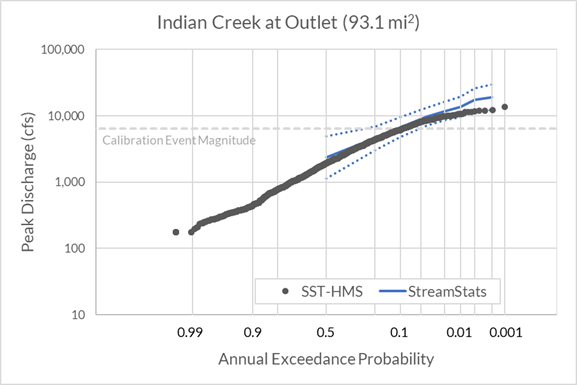
The model results shown in the plot above come from a model that was calibrated to a single large-magnitude event due to extremely limited data availability. For the results up to the magnitude of the calibration event, there is good agreement between the SST-HMS simulation and StreamStats. However, for rarer frequencies, the SST-HMS simulations are lower. This HEC-HMS model was set up to use a unit hydrograph transform for direct runoff and its parameters were calibrated to the one event. For extrapolation to rarer frequencies, it is preferable to capture the more peaked response to higher excess precipitation by applying 2-dimensional overland flow, or a process (such as the Variable Parameter Clark Unit Hydrograph) in HEC-HMS that can replicate the non-linearity in such a response. The FFRD pilot studies using SST will also be using the 2D Diffusion Wave transform method in HEC-HMS (Transform Method Improvements within HEC-HMS).
Excess precipitation grids can be generated from HEC-HMS simulations, which can be used to reveal potential areas of pluvial hazard within the watershed. The excess precipitation from each storm transposition can be aggregated into a gridded annual maximum series of excess precipitation and used as a first estimate of pluvial flood hazard. Figure 5 below shows the maximum excess precipitation for a storm event in the Iowa demonstration watershed; green pixels have the least excess and red the most.
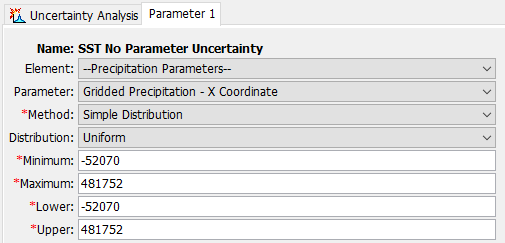
HEC-HMS implements SST using its Uncertainty Analysis compute, a tool that allows a simulation to be repeated many times while varying the input parameters. For SST, the selected storm event, and its transposed x- and y-coordinates can be varied with each storm event. Transposition of precipitation grids is a new setting inside the Gridded Precipitation method in the Meteorologic Model. To capture the uncertainty in the hydrologic response, the basin model parameters can be varied as well. Future development in HEC-HMS will allow for event seasonality to be sampled inside the Uncertainty Analysis, which will allow seasonally-based hydrologic model initial conditions to be specified. Figure 6 shows an example of the settings for random sampling of storm center x-coordinates in the HEC-HMS Uncertainty Analysis.
Stochastic Storm Transposition is a modern, data-driven approach to estimating watershed precipitation-frequency and flow-frequency. HEC-HMS has tools that facilitate the application of SST to any watershed, and throughout the course of the FFRD initiative HEC will continue to add tools and capabilities to support this modeling approach.
Last Modified: 2023-06-07 16:04:13.726