Download PDF
Download page Transform Method Improvements within HEC-HMS.
Transform Method Improvements within HEC-HMS
By: Michael Bartles, P.E.
Introduction
When modeling the precipitation-runoff process in a hydrologic model, precipitation or melted snow that is not infiltrated is subjected to a transformation process in order to estimate a runoff hydrograph. The most commonly utilized transform method within the U.S. Army Corps of Engineers (USACE) is unit hydrograph theory, which was originally derived by L.K Sherman in the early 20th century (Sherman, 1932). Since its inception, unit hydrograph theory has been widely used throughout the world as a means to predict the timing and magnitude of runoff emanating from a defined area. According to Sherman, the unit hydrograph of a watershed is “…the basin outflow resulting from one unit of direct runoff generated uniformly over the drainage area at a uniform rainfall rate during a specified period of rainfall duration” (Sherman, 1932). This implies that ordinates of any hydrograph resulting from excess precipitation of unit duration would be equal to corresponding ordinates of a unit hydrograph for the same areal distribution of rainfall, multiplied by the ratio of rainfall excess values. That is, the convolution between the unit hydrograph and the excess rainfall intensity is linear. However, due to differences in areal distributions of rainfall and hydraulic reactions between large and small precipitation events, the corresponding unit hydrographs have not been found to be equal, as implied by unit hydrograph theory (Minshall, 1960; Meyersohn, 2016). These realizations must also be combined with the fact that most precipitation events used when calibrating hydrologic models are normally much less intense, which is a common characteristic of more frequent observed events, than much less frequent hypothetical events that are used to design dams and other water resources infrastructure.
In an attempt to use reasonably conservative runoff parameters, account for non-linear responses of watersheds, and address some restrictions imposed by the linearity of unit hydrograph theory, guidance has been followed within USACE for approximately 50 years requiring the use of unit hydrograph peaking factors between 1.25 and 1.5 when simulating design storms (e.g. the Probable Maximum Precipitation, PMP) within dam safety studies (U.S. Army Corps of Engineers, 1991). In essence, unit hydrograph parameters that increase the calibrated unit hydrograph peak discharge by 25- and 50-percent are used. This action shifts the resultant peak unit response at the location of interest upwards and earlier in time while maintaining the same runoff volume. These peaking factors are typically applied uniformly throughout time and space. The concept of peaking the unit response at a particular location is visualized within Figure 1.
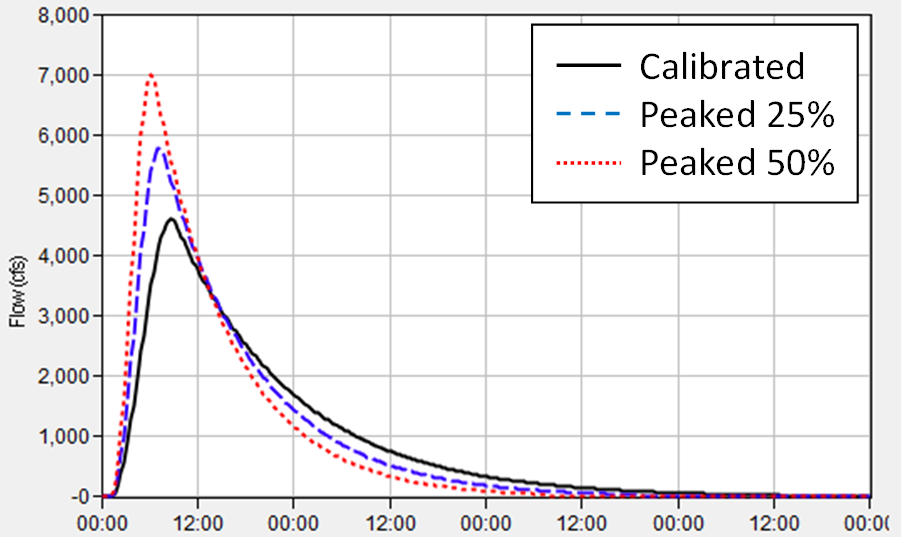
However, the applicability of these approximations is not thoroughly analyzed within most studies. For instance, it is unknown whether a 25% peaking factor over or under-predicts the true unit hydrograph of a watershed in response to an extreme precipitation event. Similarly, it is unknown whether a 50% peaking factor over or under-predicts the true unit hydrograph. Also, applying these peaking factors uniformly in time and space likely overpredicts the runoff response of a watershed during times of low excess precipitation rates (Bartles & Fleming, 2016).
Transform Method Improvements
Two new transform methods have been recently added to HEC-HMS to aid in the prediction of runoff hydrographs, especially when subjected to extreme amounts of precipitation. These new methods include the Variable Clark and the Two-Dimensional (2D) Diffusion Wave transform methods.
Variable Clark Method
The "classical" Clark unit hydrograph method, as derived by Clark (1945), explicitly represents two critical processes in the transformation of excess precipitation to runoff: 1) the translation (or movement) of excess precipitation from its origin throughout the watershed to the outlet and 2) the attenuation (or reduction) of the magnitude of the discharge as the excess precipitation is temporarily stored throughout the watershed (U.S. Army Corps of Engineers, 2021). Conceptually, water is translated from remote points to the watershed outlet with delay but without attenuation. Attenuation is then incorporated, conceptually speaking, at the watershed outlet. Three parameters are utilized within this method:
- Time of concentration (Tc), which is equivalent to the time it takes for excess precipitation to travel from the hydraulically-most remote point of the watershed to the outlet,
- Watershed storage coefficient (R), which is equivalent to attenuation due to storage effects throughout the watershed (Kull & Feldman, 1998), and
- Time-Area histogram, which represents the watershed area that contributes to flow at the outlet as a function of time.
This method is mature, well established, well documented, simple to set up and use, and computationally fast (which aids calibration and uncertainty analyses). Also, parameters can be regionalized, related to measurable basin characteristics, and varied with excess-precipitation rates, which are important traits for methods used in hydrologic modeling applications. However, the "classical" Clark method suffers from the inability to vary the aforementioned parameters (notably Tc and R) in time.
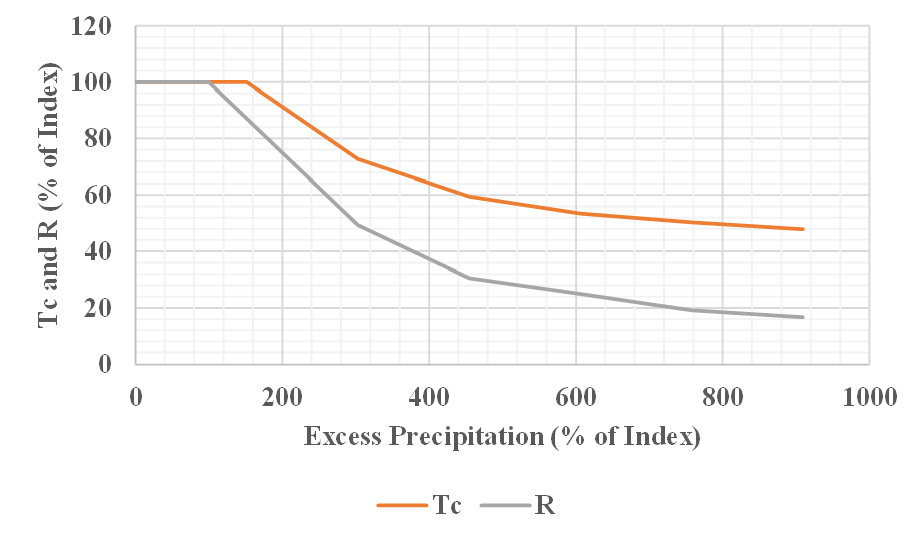
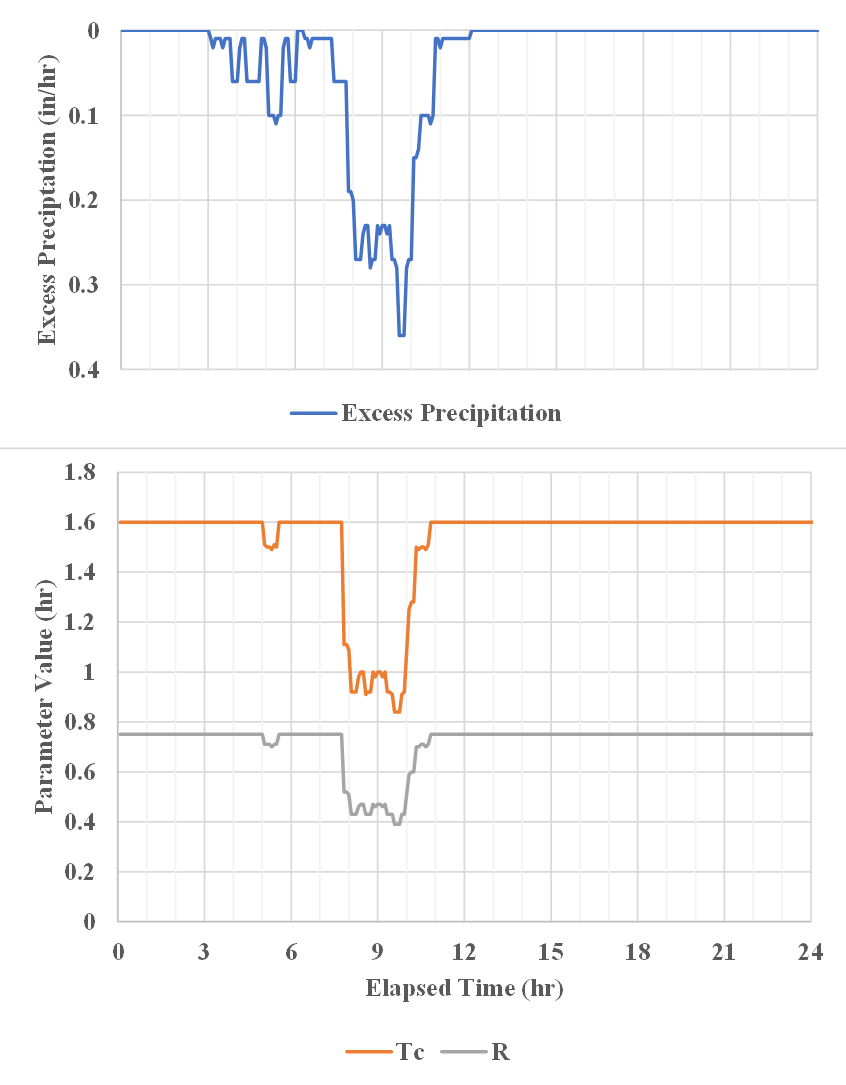
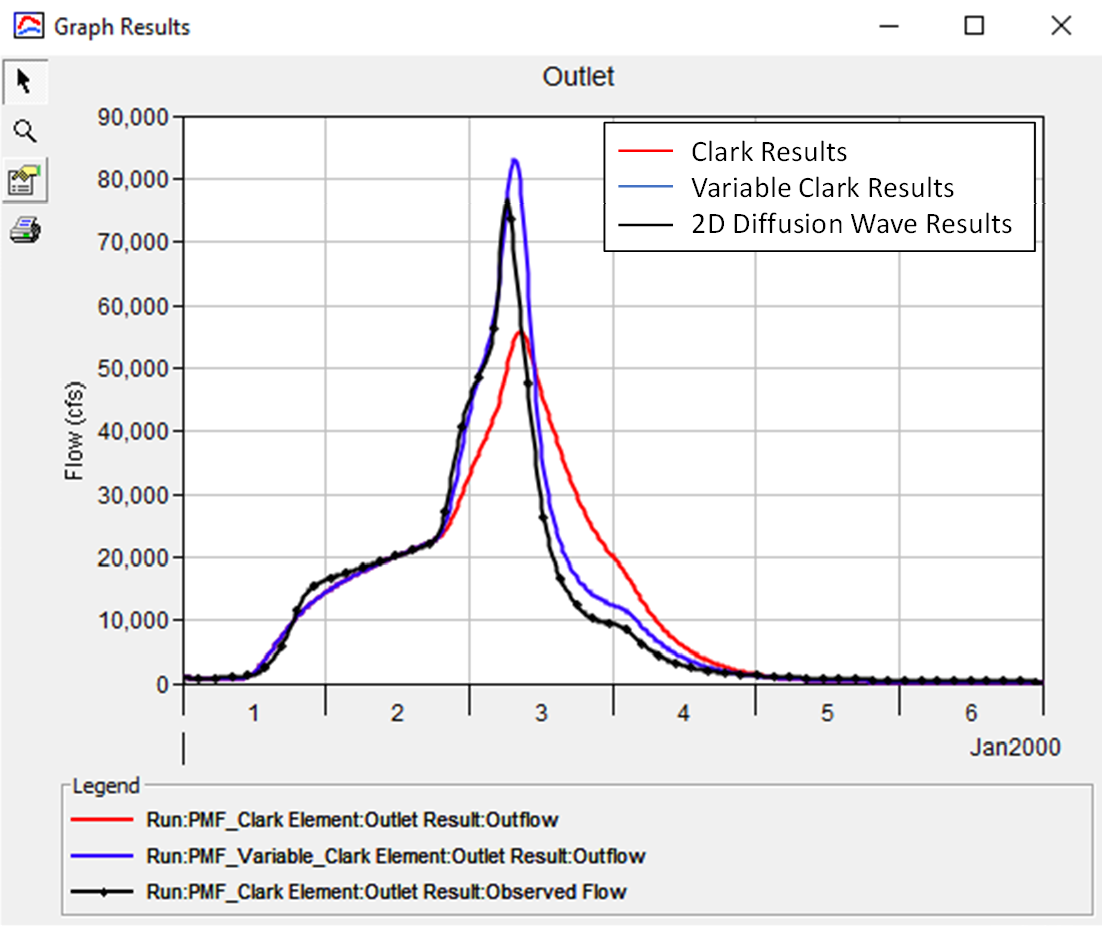
The new Variable Clark unit hydrograph method contained within the Hydrologic Engineering Center’s (HEC) Hydrologic Modeling System (HEC-HMS) builds upon the “classical” Clark unit hydrograph method by allowing parameters (e.g., Tc and R) to change based on precipitation intensity throughout a simulation. This new method allows modelers to efficiently simulate the nonlinear dynamic runoff response of a watershed in both a spatially and temporally appropriate manner when subjected to large excess precipitation rates, such as those expected during design storms like the Probable Maximum Precipitation (Bartles, 2014; Bartles & Fleming, 2016). An example of these relationships is shown in Figure 2. Notice how the time of concentration and storage coefficient decrease as excess precipitation increases. An example application of these relationships when subjected to an extreme precipitation event is shown in Figure 3. Within this example, Tc and R vary during the simulation as excess precipitation rates increase and decrease.
2D Diffusion Wave Method
The 2D Diffusion Wave method provides an alternative to the various unit hydrograph and Kinematic Wave methods that are available within HEC-HMS. Within this method, water is explicitly routed throughout a computational mesh using physically-based, governing flow equations (U.S. Army Corps of Engineers, 2022). This method makes use of an implicit finite volume algorithm which allows for advantages such as:
- Larger computational time steps than explicit methods,
- Improved stability and robustness over traditional finite difference and finite element techniques,
- Efficient wetting and drying of 2D cells, and
- Subcritical, supercritical, and mixed flow regimes.
Unstructured or structured computational meshes can be utilized within this method that include triangular, square, rectangular, or even eight-sided elements. Computational cells and cell faces are pre-processed to contain detailed hydraulic property tables including elevation-volume and elevation-conveyance relationships, amongst others. This type of model is often referred to as a "high resolution subgrid model" (Casulli, 2008). The 2D Diffusion Wave method can be used to better recreate anticipated non-linear runoff responses when subjected to large amounts of precipitation when compared to unit hydrograph transform methods (Bartles, 2017). However, the 2D Diffusion Wave method requires additional parameters and is more computationally intensive than unit hydrograph transform methods which may not be cost-effective in practice compared to more traditional transform methods.
Example applications of the 2D Diffusion Wave method within HEC-HMS can be found below:
A presentation detailing the 2D Flow (and 2D Sediment) modeling capabilities within HEC-HMS can be viewed here:
Combining the Benefits of These New Transform Methods
The two aforementioned transform methods can be combined in order to amplify the benefits (e.g. accuracy of the 2D Diffusion Wave method and computational efficiency of the Variable Clark method) while negating the negative consequences (e.g. computational expense of the 2D Diffusion Wave method). Specifically, the excess precipitation vs. Tc and R relationships that are required when using the Variable Clark unit hydrograph method can be derived from simulations that utilize the 2D Diffusion Wave method using the following process:
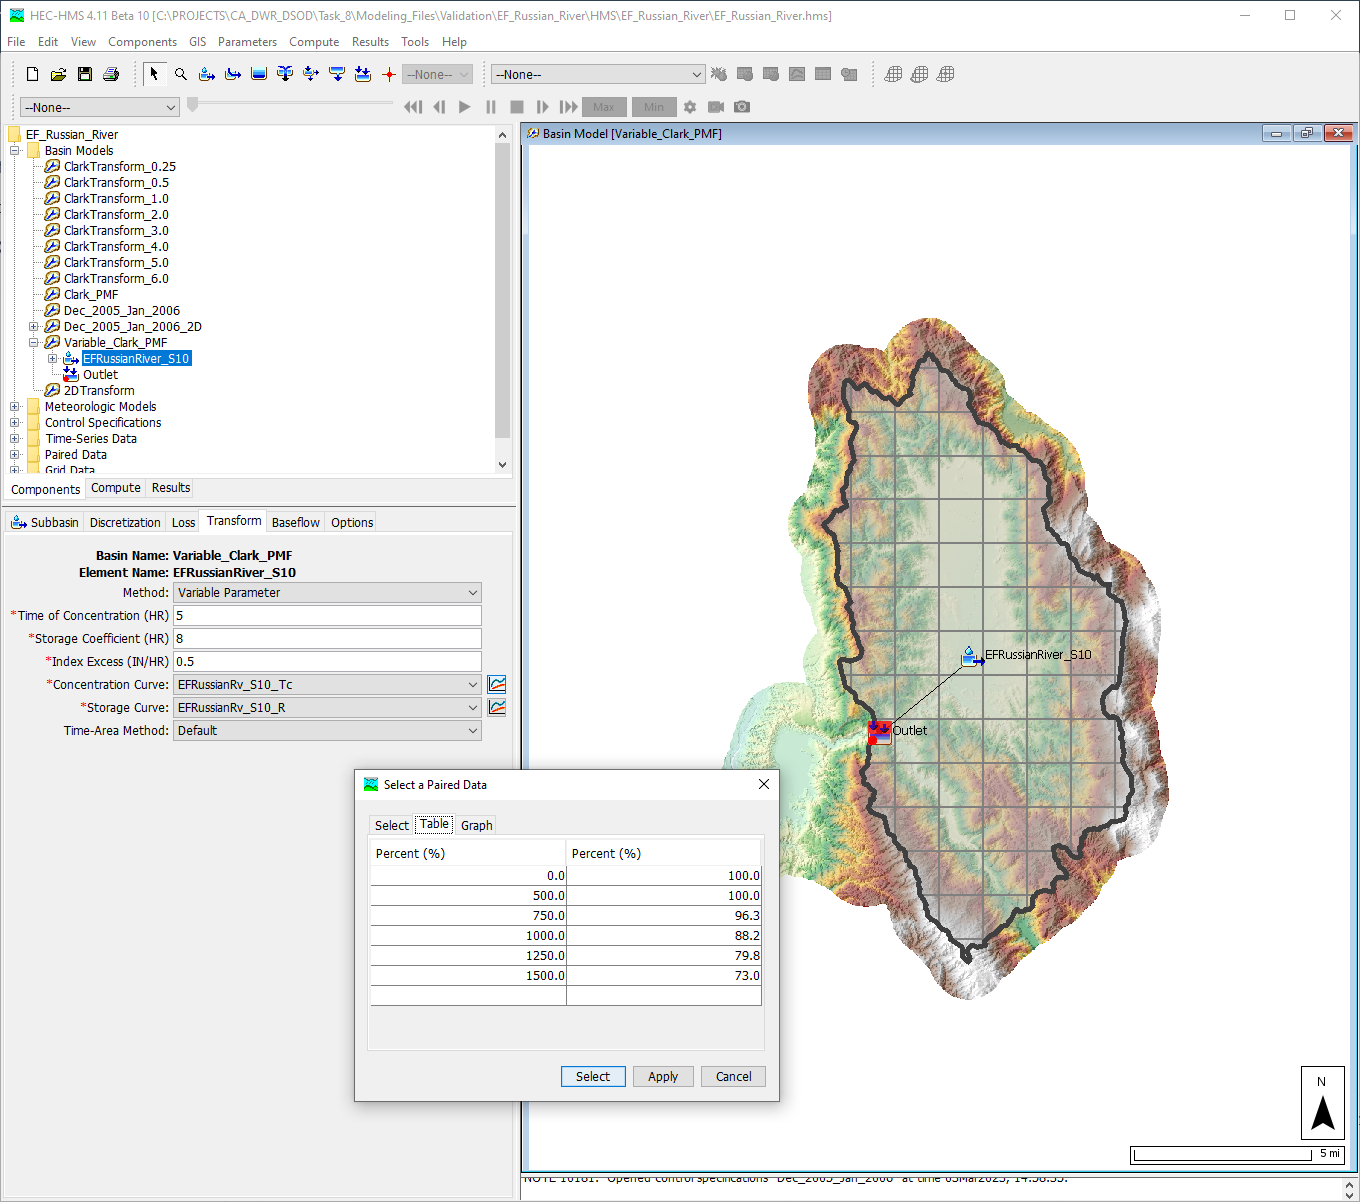
- Refine initial estimates of 2D Diffusion Wave and Clark unit hydrograph parameters using a model calibration process, as shown in Figure 4.

- Subject the calibrated 2D Diffusion Wave model to varying excess precipitation rates (0.25-, 0.5-, 1-, 2-, 3-, 4-, 5-, and 6-inches over one hour), as shown in Figure 5. It is important to not simulate losses or baseflow within these simulations. Store the outflow hydrographs for use in subsequent steps.

- Using the same excess precipitation rates mentioned above, calibrate Clark unit hydrograph parameters using the 2D Diffusion Wave results as "observed" data, as shown in Figure 6.

- Develop relationships of excess precipitation vs. Tc and R, as shown in Figure 7.

- Choose an appropriate index excess precipitation rate and index Clark unit hydrograph parameters. This is required to derive ratios of Tc and R for each excess precipitation rate relative to the index parameters. This step will result in relationships like those shown in Table 1, which can be used within HEC-HMS, as shown in Figure 8.
% of Excess Precipitationindex | % of Tcindex | % of Rindex |
|---|---|---|
37.9 | 218.3 | 534.0 |
75.8 | 143.2 | 337.3 |
151.5 | 102.0 | 138.6 |
303.0 | 72.8 | 49.3 |
454.5 | 59.5 | 30.5 |
606.1 | 53.4 | 24.9 |
757.6 | 50.3 | 19.1 |
909.1 | 47.8 | 16.7 |
Application in California
The modeling process described above was performed for numerous watersheds in California in order to derive regression equations that can be used to predict Variable Clark unit hydrograph parameters throughout the entire state. These equations relate physically measurable watershed characteristics (e.g. longest flow path) to time of concentration (Tc) and watershed storage coefficient (R) for multiple excess precipitation rates. Sixteen locations, corresponding to either U.S. Geological Survey stream gages or USACE reservoirs, were chosen throughout California to develop the Clark unit hydrograph parameter regression equations. HEC-HMS was used to create precipitation-runoff models using publicly available Geographic Information System (GIS) data. For those modeling domains, drainage areas ranged from 8.6 square miles (sq. mi.) to 113.2 sq. mi. in size. A list of 13 watershed characteristics were considered for use. GIS data was used to estimate these parameters for each modeling domain.
The 2D Diffusion Wave method was used within each modeling domain to route runoff to best recreate anticipated non-linear runoff responses when subjected to large amounts of precipitation. Initial model parameter estimates were subjected to a calibration process that compared computed outputs against observed runoff data. Large runoff events were selected for use in model calibration since these regression equations are intended to be used in dam safety studies. Parameters were modified in order to achieve an adequate fit to the observed data using multiple statistical metrics.
Each calibrated model which used the 2D Diffusion Wave method was then subjected to 0.25-, 0.5-, 1-, 2-, 3-, 4-, 5-, and 6-inches of excess precipitation over one hour. The resultant outflow hydrographs were then used to calibrate Clark unit hydrograph parameters. Index excess precipitation and Clark unit hydrograph parameters were then selected for each modeling domain using calibrated results. Finally, ratios of the calibrated Clark unit hydrograph parameters for each excess precipitation rate relative to the index parameters were calculated and recorded.
Separate regression equations were developed for ratios of Tc and R to index parameters for all of the aforementioned excess precipitation rates. The same predictive variables were chosen for each excess precipitation rate to ease the use of the regression equations and mitigate the potential for sharp inflection points in the output or increasing ratios of Tc and R as excess precipitation rates increase for reasonable parameter values.
Predicted Tc and R values obtained through the use of the derived regression equations were then evaluated using a validation process at several locations. The results of this validation process demonstrated that each regression equation adequately predicted Variable Clark unit hydrograph parameters for use within extreme event simulations, as shown in Figure 9.
An example application of these regression equations for an independent location within the Middle Fork American River is shown here: Variable Clark Unit Hydrograph Workshop. An additional example of this modeling process is demonstrated here: Creating Variable Clark Transform Method Parameters using the 2D Diffusion Wave Transform Method. A recent conference paper containing additional details can be found here: Bartles_Meyersohn_CA_Unit_Hydrograph_Regression_Equations. Similar studies are being undertaken by USACE in order to derive regression equations that can predict Variable Clark unit hydrograph parameters for additional regions within the United States.
References
Bartles, M. (2014). Hydrologic Analysis of Prompton Dam Using a Physically-Based Rainfall Runoff Model. Villanova, PA: Villanova University.
Bartles, M. (2017). Improved Applications of Unit Hydrograph Theory within HEC-HMS. World Environmental and Water Resources Congress. Sacramento, CA: ASCE.
Bartles, M., & Fleming, M. (2016). Unit Hydrograph Peaking Factors and their Application to PMF Simulations. United States Society on Dams. Denver, CO: USSD.
Casulli, V. (2008). A high-resolution wetting and drying algorithm for free-surface hydrodynamics. Numerical Methods in Fluids, 391-408.
Clark, C. O. (1945). Storage and the Unit Hydrograph. Transactions of the American Society of Civil Engineers, Volume 110, 1419-1449.
Meyersohn, W. D. (2016). Runoff Prediction for Dam Safety Evaluations Based on Variable Time of Concentration. Journal of Hydrologic Engineering.
Minshall, N. E. (1960). Predicting Storm Runoff on Small Experimental Watersheds. ASCE Journal of the Hydraulics Division HY8, 17-37.
Sherman, L. K. (1932). Streamflow from Rainfall by the Unit Graph Method. Eng. News Rec.
U.S. Army Corps of Engineers. (1991). Inflow Design Floods for Dams and Reservoirs, Engineer Regulation 1110-8-2. Washington, D.C.: USACE.
U.S. Army Corps of Engineers. (2021, November 15). Hydrologic Modeling System HEC-HMS. Retrieved from Technical Reference Manual: https://www.hec.usace.army.mil/confluence/hmsdocs/hmstrm
U.S. Army Corps of Engineers. (2022, May 15). River Analysis System HEC-RAS. Retrieved from User's Manual Version 6.2: https://www.hec.usace.army.mil/confluence/rasdocs/r2dum/latest
Last Modified: 2023-06-09 09:40:20.103