Download PDF
Download page Preprocessing Terrain Data to Delineate Subbasin and Reach Elements.
Preprocessing Terrain Data to Delineate Subbasin and Reach Elements
Last Modified: 2025-01-27 16:03:50.253
Software Version
HEC-HMS version 4.13 beta 4 was used to create this tutorial. You will need to use HEC-HMS version 4.13 beta 4, or newer, to open the project files.
Project Files
Continue with your current project file from Creating and Linking Terrain Data into a Basin Model.
Overview
In this tutorial you will use the GIS delineation tools to delineate subbasin and reach elements. The delineation will be based on the stream threshold. The next tutorial shows how to customize the delineation using split and merge tools.
Terrain Preprocessing
- Open the Punxsutawney project and then open the Mahoning Creek Basin Model. A terrain dataset has already been added to the basin model and background shapefiles have been loaded as well.

- From the GIS menu select Preprocess Sinks. This tool creates two new layers, Sink Fill and Sink Locations. These layers will be automatically added to the Basin Model Map. You can turn them off from the Map Layers dialog (select View | Map Layers to open the Map Layers dialog). The Sink Locations dataset shows the amount of fill required for water to move from cell to cell (shows how much fill is required to remove pits in the terrain). The Sink Fill dataset is the hydrologically correct terrain dataset and is used for delineation.
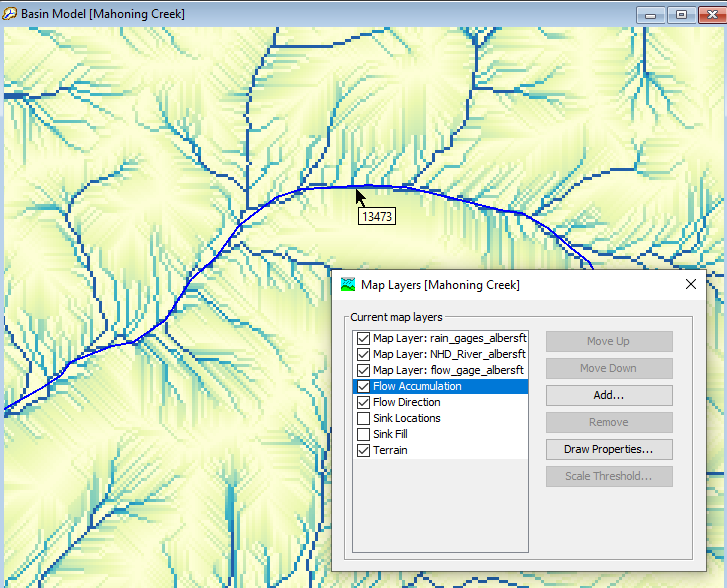
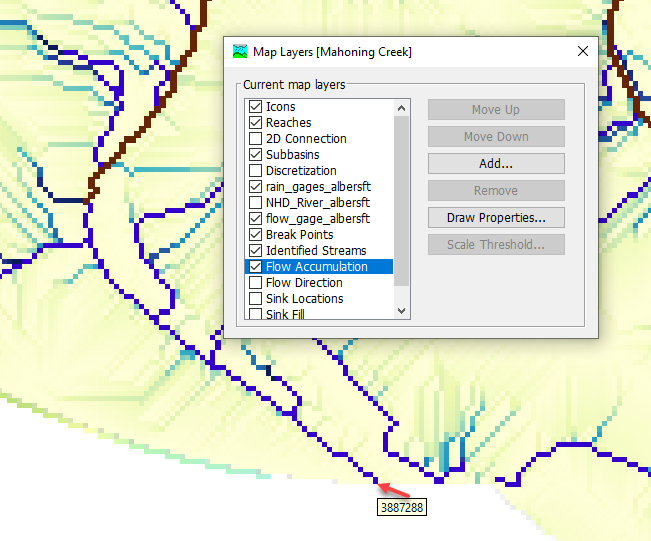
From the GIS menu select Preprocess Drainage. This tool creates two new layers, Flow Direction and Flow Accumulation. The flow direction dataset shows the direction of flow from one grid cell to the next. The flow accumulation grid shows the number of upstream grid cells. Zoom-in to a part of the watershed to display the details of the grid cells that make up the flow accumulation grid. Remember to select the Flow Accumulation layer in the Map Layers dialog for the correct values to display when hovering your mouse cursor above the basin. Each grid cell value is computed by summing the total number of grid cells that flow into the grid cell. Grid cells with a value of 0 are located on the topographic divide and grid cells with a large value make up the stream network. Notice how the values get progressively larger near the flow gage location (close to the outlet of the watershed).

Draw Properties
You may need to edit the draw properties of the flow accumulation raster to see detailed streams. With the Flow Accumulation layer selected, click the Draw Properties... button and set the Symbology to Stretch, and then set the Max to a value of 200. Finally, expand the Additional Setting and choose a blue color for values above the Max color.
Select View | Map Layers and turn off the Flow Direction and Flow Accumulation layers.
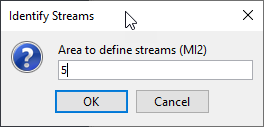
- From the GIS menu select Identify Streams. A pop-up window will prompt you to specify a threshold for stream delineation. This value is the minimum drainage area for the program to identify a stream. Smaller values will result in more subbasins and reaches. For this tutorial, enter 5 square miles as the threshold value. This step creates a new Identified Streams layer.
You might need to turn off the NHD_River_albersft shapefile to see the Identified Streams layer in the Basin Model Map. The "Diverging BlueBrown" color ramp might make the identified streams show up better in the map.
Automated Watershed Delineation
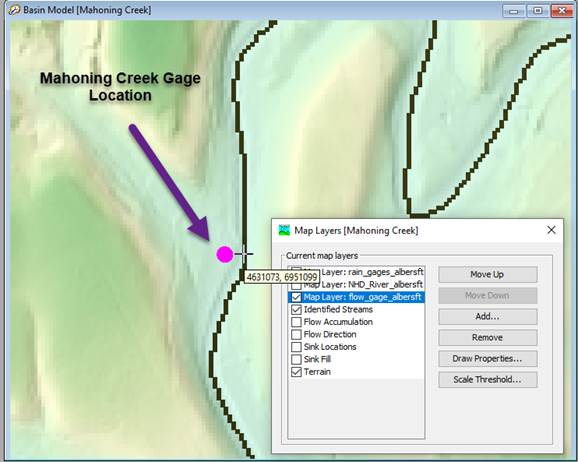
- The study area is defined by identifying an outlet. HEC-HMS GIS tools will extract data for the drainage area upstream of the defined outlet. This will be done using the Break Point tool and the Identified Streams layer. This tutorial will use the Mahoning Creek at Punxsutawney stream gage to define the outlet. The Mahoning Creek at Punxsutawney stream gage is contained in the flow_gage_albersft map layer. Make sure this layer is turned on (turn on the rain_gages_albersft map layer). Make sure the Identified Streams layers is visible.
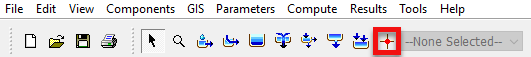
At least one break point must be added to the basin model. The program uses the most downstream break point as the outlet of the watershed. The break point must be located on top of a grid cell within the Identified Streams layer. To place a break point, select the Break Point Creation Tool on the toolbar,
 .
.
In the basin map, zoom in and place a break point exactly on the identified stream next to the flow_gage_albersft stream gage (do not put the break point on top of the stream gage point). Name the break point Outlet as seen in the bottom figure.


Breakpoint Locations
Breakpoints must be located directly on top of the Identified Streams layer. If the breakpoints are not located exactly on the Identified Streams layer, errors may result.
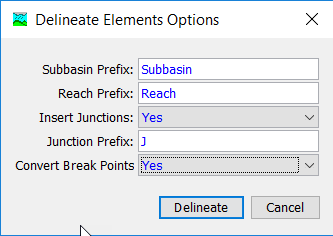
- From the GIS menu select Delineate Elements to delineate the watershed. A Delineate Elements Options dialog will open with options for setting prefixes for the element names. Choose "Subbasin" for subbasin elements, "Reach" for reach elements, and "J" for junction elements (make sure the Insert Junctions option is set to Yes). Finally, set the Convert Break Points option to Yes. This option will automatically assign computation points to the break points. Click the Delineate button. Subbasins, reaches, and junctions will be generated and automatically assigned names.
- The delineated watershed should look similar to the following figure. The subbasin and reach network is based on a stream threshold of 5 square miles.

Questions:
1) What is the largest cell value from the Flow Accumulation grid? What is the total drainage area for the largest Flow Accumulation cell (cells are 34.31ft * 34.31ft)?
The largest flow accumulation value is 3887288. This value represents a drainage area of 3887288 grid cells * 34.31 ft * 34.31 ft / 5280 (ft/mi) / 5280 (ft/mi) = 164.14 square miles.
2) Why might you add multiple break points.
The most downstream break point is required to identify the outlet of the watershed. Upstream break points can be used to force subbasin outlets to occur at a specific location. Flow gage locations, boundary conditions for other models, or analysis points could be reasons to add additional break points.
3) How many Subbasins are there in the basin model? Why do some of the subbasins have a drainage area larger than 5 square miles?
There are 17 subbasins when using a default stream threshold of 5 square miles. The stream threshold does not necessary translate to subbasin area. HEC-HMS will only identify streams that exceed a drainage area of 5 square miles. Subbasins are then delineated for each stream segment. Long, skinny watersheds might not have any tributaries that exceed the drainage area threshold; therefore, there could be a large area with no reach segments. Look at the Stump Creek watershed (Subbasin 1). The Identified Stream layer has a stream segment starting at 5 square miles, but there are no additional reach segments until the Confluence with the East Branch Mahoning Creek at Junction J4.

Continue to Using Merge and Split Tools to Customize Subbasin and Reach Delineation