Download PDF
Download page Applying the Frequency Analysis Compute Type - Deterministic.
Applying the Frequency Analysis Compute Type - Deterministic
Return to Applying the Frequency Analysis Compute Type.
Last Modified: 2026-09-21 08:57:09.91

Software Version
HEC-HMS version 4.15-beta.1 was used to create this tutorial. You will need to use HEC-HMS version 4.15, or newer, to open the project files.

Suggested Time
This tutorial should take approximately 30 minutes to complete.

Download the initial project files here:

Background
In this tutorial, you will learn how to apply the Frequency Analysis compute type, which became available in HEC-HMS version 4.10. You will:
- use the Frequency Analysis Manager to create a new Frequency Analysis compute
- add ordinates to the new compute
- add an observed frequency curve for comparison
- compute the Frequency Analysis and review the results
The Frequency Analysis consolidates multiple simulation runs and summarizes their results within a single table. Before the Frequency Analysis compute type was added, you needed to create and run a simulation for each frequency event, and you could only view results for the individual simulations. This tutorial demonstrates how the Frequency Analysis compute type removes the need for individual simulation runs, reducing the analysis to a single compute that provides the results in a single curve and table. This saves setup time and makes data management much easier.
Data
The provided watershed–Indian Creek–has been divided into four subbasins, with a computation point at the Marion Junction. The initial watershed has been calibrated to the July 2014 event. The project contains the input data needed for a rainfall-runoff frequency analysis, including NOAA Atlas 14 precipitation-frequency grids for the 24-hour duration, 2-year through 1000-year events, and the NOAA Atlas 14 Volume 8, temporal distribution Area 3, second-quartile 50% temporal pattern. Nine hypothetical storm meteorologic models that use the Atlas 14 grids are also included.
Existing simulation runs include a calibration simulation for the July 2014 event, as well as a simulation run for each of the nine frequency events. The initial project represents how frequency events were modeled before the Frequency Analysis compute type was added.
Creating a Frequency Analysis deterministic compute
The Frequency Analysis compute type combines multiple simulations into a single compute and consolidates their results into a computed frequency curve.
- Click Compute | Frequency Analysis Manager.
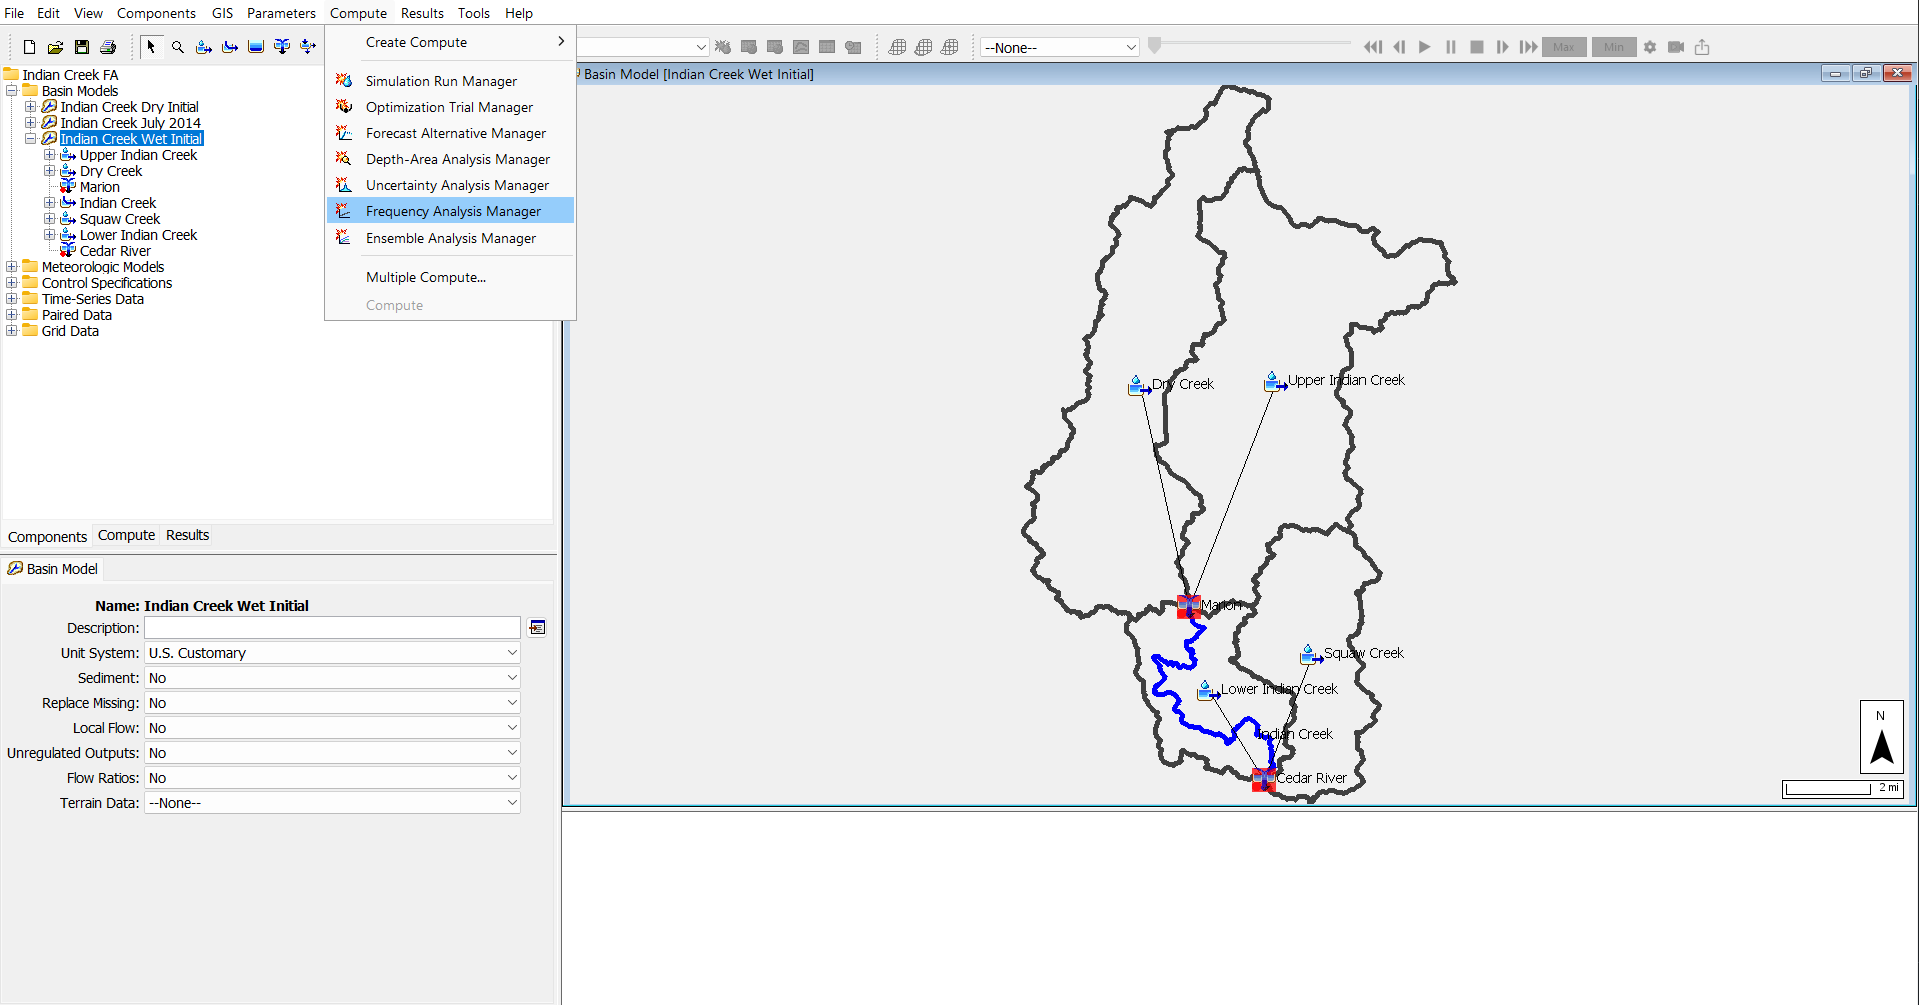
- In the Frequency Analysis Manager, click the New button.
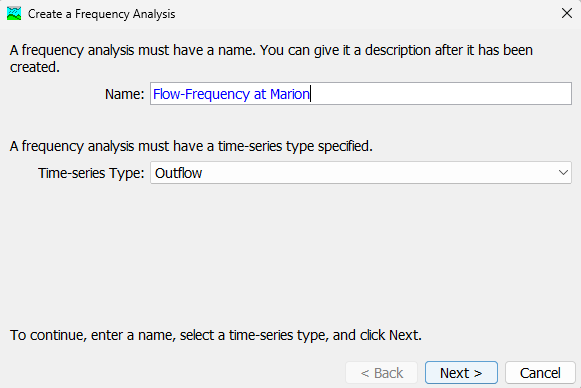
- Name the new Frequency Analysis compute Flow-Frequency at Marion, then click the Next button. Click the Finish button to create the new compute.
- In the Watershed Explorer, click the Compute tab. A new Frequency Analysis folder has been added to the tree. Expand the folder and select the Flow-Frequency at Marion analysis that you just created.
- Set the component editor as shown below. For Element, select Marion. For Time Interval, select 1 Hour. Leave Compute Mode set to Deterministic.

- In the Watershed Explorer, right-click Flow-Frequency at Marion, then click Add Ordinate to add the first ordinate.

- Fill in the parameters for Ordinate 1 as shown below. For Annual Exceedance Probability, select 50.0% (the 2-year event). For Basin Model, select Indian Creek Wet Initial, and for Meteorologic Model, select 2yr. Set the start date to 01Jan2100 and start time to 00:00. Set the end date to 03Jan2100 and end time to 00:00. Save your project.

- Create Ordinate 2 by right-clicking Ordinate 1 in the tree and selecting Copy Ordinate. For Annual Exceedance Probability, select 20.0% (the 5-year event), and for Meteorologic Model, select 5yr. The remaining parameters stay the same as Ordinate 1.

- Copy Ordinate 2 seven more times (for a total of nine ordinates), changing the Annual Exceedance Probability and Meteorologic Model for each copy. When finished, you should have ordinates for the 2-year, 5-year, 10-year, 25-year, 50-year, 100-year, 200-year, 500-year, and 1000-year events. Save your project.
Adding an Observed Frequency Curve to a Frequency Analysis
HEC-HMS version 4.15 added Flow-Frequency Curve and Stage-Frequency Curve paired data types. You can associate one of these with a Frequency Analysis to compare the computed results against an "observed" curve, such as a flow-frequency curve from a Bulletin 17C analysis. This project includes Bulletin 17C results for the Marion streamflow gage.
- Follow the steps in the "Creating a Flow-Frequency Curve paired data component" section of Importing a Flow-Frequency (or Stage-Frequency) Curve into HEC-HMS to import the Bulletin 17C curve as a paired data component.
- Follow the steps in the "Adding an Observed Frequency Curve to a Frequency Analysis" section of the same guide to select the curve in Flow-Frequency at Marion.
Computing a Frequency Analysis and viewing results
- Run the analysis by clicking the Compute button
 in the Compute Control bar. The Compute Progress dialog will open, showing the ordinates being computed sequentially.
- View the results by clicking the Results tab and expanding the Frequency Analyses | Flow-Frequency at Marion | Marion nodes in the results tree.
- First, open the Frequency Curve Plot. The results for Flow-Frequency at Marion should appear as shown below. The HEC-HMS computed results for each ordinate are shown in blue and plotted against the "observed" Bulletin 17C results, which are shown in grey.

HEC-SSP Output
When you run a Bulletin 17C analysis in HEC-SSP, the output DSS results contain the computed curve as well as the 5-percent and 95-percent confidence limit curves. Because the paired data curve in HEC-HMS was created from the HEC-SSP output DSS data, the confidence limit curves are included in this results plot.
Using the Frequency Curve Plot for Calibration
In this example, the computed frequency curve (blue) falls mostly within the confidence limits of the observed Bulletin 17C curve (grey). However, the computed ordinates on the frequent end of the curve (2-year and 5-year) fall below the observed mean curve, whereas the computed ordinates on the rarer end of the curve (25-year through 1000-year) fall above it. The Bulletin 17C results in this case contain high levels of uncertainty due to the short record length at the Marion USGS streamflow gage. Without additional information and context, however, it might still be prudent to calibrate the model to better match the Bulletin 17C results. In this example, each ordinate uses the same basin model. For calibration purposes, you could create a unique basin model for each ordinate and adjust key basin parameters until each ordinate better matches the observed mean curve.
- Next, open the Frequency Curve Table. It summarizes the computed flow at the Marion junction for all nine events, which are also included as independent simulation runs in these project files for reference. The figure below shows the 10yr Simulation Run summary in the upper left and the Flow-Frequency at Marion Frequency Analysis summary in the lower right. The Frequency Analysis results contain the same information as the nine individual simulation runs. The advantages of the Frequency Analysis are setup efficiency, all frequency results contained within a single compute, and a flow-frequency curve that can be easily compared against other external curves.

Download the final project files here:
Continue to Importing a Flow-Frequency (or Stage-Frequency) Curve into HEC-HMS.