Download PDF
Download page Rule-Based Option for an HEC-HMS Reservoir Element.
Rule-Based Option for an HEC-HMS Reservoir Element
Last Modified: 2025-06-12 07:41:00.442
This tutorial demonstrates an option for using the rule-based option for a reservoir element in HEC-HMS.
Software Version
HEC-HMS version 4.13 beta 6 was used to create this example. You can open the example project with HEC-HMS 4.13 beta 6 or a newer version.Overview
In this tutorial you will add a reservoir element to a basin model and configure the reservoir element to use the rule-based method for computing outflow from the reservoir. We will compare simulated and observed reservoir elevation to evaluate model performance. Observed discharge from the reservoir has already been added to the project along with some additional data needed to configure the reservoir element and run a simulation. As mentioned in Introduction to Modeling Reservoir Operations with HEC-HMS, the HEC-HMS model for the watershed upstream of the reservoir has been calibrated to the simulation time window used for this tutorial.
As shown in the figure below, the reservoir in this example has a seasonal guide curve that reduces storage in the fall and winter, during the flood season, and increases storage late in the winter and spring to capture runoff from rain and snowmelt. The reservoir storage is divided into a flood control pool, green shaded area in the figure below, and a conservation pool, yellow shaded area in the figure below.
Water is released from the flood control pool using a gated outlet to lower the reservoir's storage to the guide curve. The figure below shows the flood control pool is broken up into zones where each zones has different maximum discharge rates. The downstream channel can pass 3,500 cfs without causing flooding. An uncontrolled spillway is located at the bottom of Zone 5, controlled operations shift to uncontrolled operation in Zone 5. The reservoir does contain complex operations that includes forecasted runoff into the reservoir, due to rain and snowmelt. Also, operations try to hold releases steady for five days. Since HEC-HMS cannot capture complex operations, release rules will be configured to approximate reservoir operations in the flood control pool.
Water is released from the conservation pool to meet irrigation demand. Zone 1 covers a period from July 1 – September 30 where conservations releases are made for irrigation. Irrigation demand is variable and based on long term climate conditions. As shown in the example, the HEC-HMS model will approximate these conservation pool operations.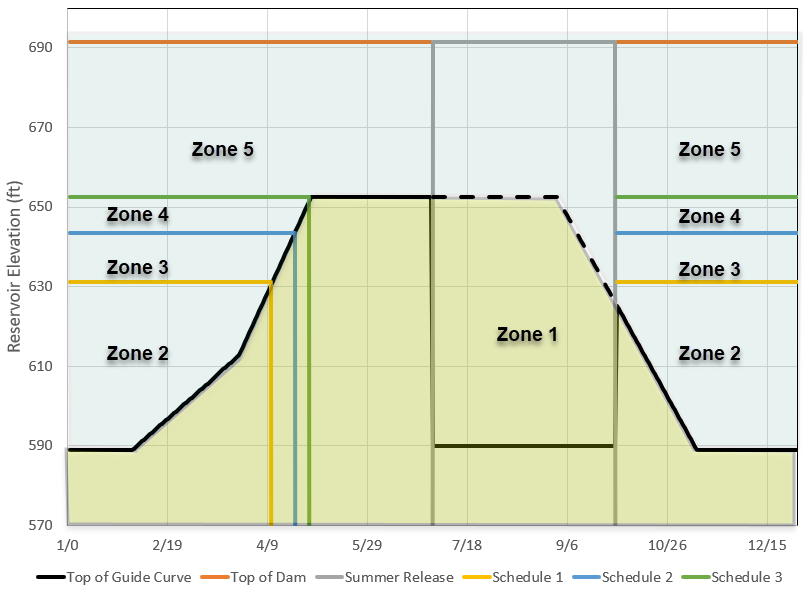
- Unzip and open the project.
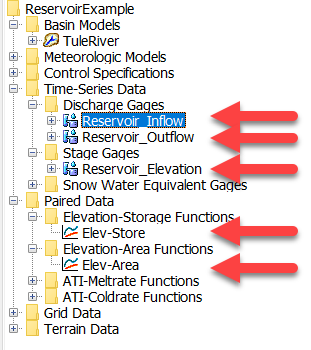
- Explore the data folders. You should see Reservoir_Inflow, Reservoir_Outflow, and Reservoir_Elevation time-series gages. You can view the data in these gages by clicking on the time-window node in the Watershed Explorer and then selecting the Graph tab. The elevation-storage (Elev-Store) and elevation-area (Elev-Area) paired data curves have already been added to the project as well. Elevation-area is required to model evaporation from a reservoir element.
- Open the TuleRiver basin model and run the WY2017-2018 simulation run. The simulation will take approximately 30 seconds to compute. View results at the ReservoirInflow junction. The calibration metrics show good model performance for the simulation period. It is also important to point out that the observed flow is daily average flow and the HEC-HMS model is simulated using a 1-hour simulation time step (and 1-hour precipitation data).
- Add a reservoir element to the project, named Schafer_Dam. Connect the ReservoirInflow junction to the new reservoir element.
- Open the component editor for the Schafer_Dam reservoir element.
- Set the Method to Rule-Based Operations.
- Choose the Elevation-Storage-Area Storage Method.
- Select the Elevation-Storage Function.
- Select the Elevation-Area Function.
- Choose Elevation for the Initial Condition and enter an Initial Elevation of 585 feet. This is the observed elevation on Oct 1, 2016 at 00:00.
- Select 5 Zones.
- Select 1 Outlet.
- Select 1 Spillway.
- Select 1 Dam Top.
Choose Yes for the Evaporation option.

Add two Storage Patterns paired data to the project, named Guide Curve and Minimum Curve (use the Paired Data Manager to create the new storage patterns). If the reservoir pool is below the storage objective, then reservoir releases are minimized to store more water. If the reservoir pool is above the storage objective, then reservoir releases are increased to evacuate more water. The following figure shows the Guide Curve Storage Pattern. Notice the seasonal storage pattern. The reservoir is drawn down to a minimum storage of 7,300 acre-feet during the flood season and allowed to increase to 82,900 acre-feet to capture runoff/snowmelt for summer irrigation. The Minimum Curve is used to define the storage objective during the summer irrigation season (zone 1). Water from the reservoir is released for irrigation and the reservoir pool is allowed to be drawn down to a 7,300 acre-feet from July 1 – September 30.
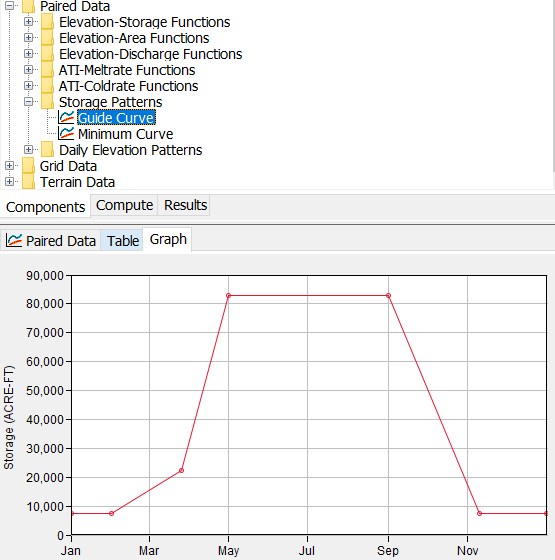
Enter the following information for the Guide Curve Storage Pattern (copy and paste does work).Time (ddMMM, HH:mm) Storage (Acre-Ft) 01Jan, 00:00 7300 01Feb, 00:00 7300 26Mar, 00:00 22300 01May, 00:00 82900 01Sep, 00:00 82900 10Nov, 00:00 7300 31Dec, 23:59 7300 Enter the following information for the Minimum Curve Storage Pattern.
Time (ddMMM, HH:mm) Storage (Acre-Ft) 01Jan, 00:00 7300 31Dec, 23:59 7300 - Add five Daily Elevation Patterns paired data to the project, named Summer Release, Top of Dam, Top of Schedule1, Top of Schedule2, and Top of Schedule3 (use the Paired Data Manager to create the daily elevation patterns). The daily elevation patterns are used to define the maximum reservoir elevation for each day of the year when operations are considered to be within user defined zones. The daily elevation pattern is a paired data curve that has an entry for each day of the year (01Jan-31Dec). If the entry is left blank for a date, then the reservoir will not use that Zone for operations for that date. The figure below shows the elevation pattern for the Summer Release pattern. This pattern will be used for zone 1 in the reservoir element. Notice the elevation pattern is only defined from July 1 – September 30. The other elevation zones are not defined in this date range. The Top of Schedule1, 2, and 3 elevation patterns match the zones identified in the flood pool. The Top of Dam flood zone covers the pool from 0.5 feet above the top of the dam down to the spillway invert. Within this zone, the general outlet will have no impact as all releases will occur from the uncontrolled spillway (and dam top if the reservoir fills high enough). Many reservoirs will have additional operational criteria as the elevation approaches the dam top. In this case, you would add additional zones to capture scheduled releases.
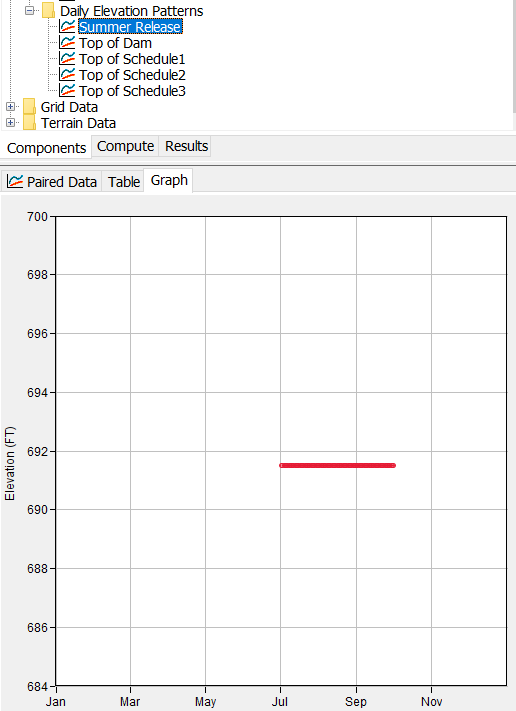
Enter the following information for the Summer Release Elevation Pattern. You can use the Fill option (accessed by right clicking in the table) to quickly populate the table.
Time (ddMMM) Elevation (Ft) 01 July - 30 September 691.5 Enter the following information for the Top of Dam Elevation Pattern.
Time (ddMMM) Elevation (Ft) 01 January - 31 December 692 Enter the following information for the Top of Schedule1 Elevation Pattern.
Time (ddMMM) Elevation (Ft) 01 January - 11 April 631.1 01 October - 31 December 631.1 Enter the following information for the Top of Schedule2 Elevation Pattern.
Time (ddMMM) Elevation (Ft) 01 January - 23 April 643.4
01 October - 31 December 643.4
Enter the following information for the Top of Schedule3 Elevation Pattern.
Time (ddMMM) Elevation (Ft) 01 January - 30 April 652.5 01 October - 31 December 652.5 As shown below, five zones were added to the reservoir. A zone is defined by a daily elevation curve and a storage objective along with rules that guide how releases are made to keep the reservoir at the storage objective. Open the Zone 1 component editor. Set the Maximum Elevation curve to Summer Release and add 1 Rule to this zone.
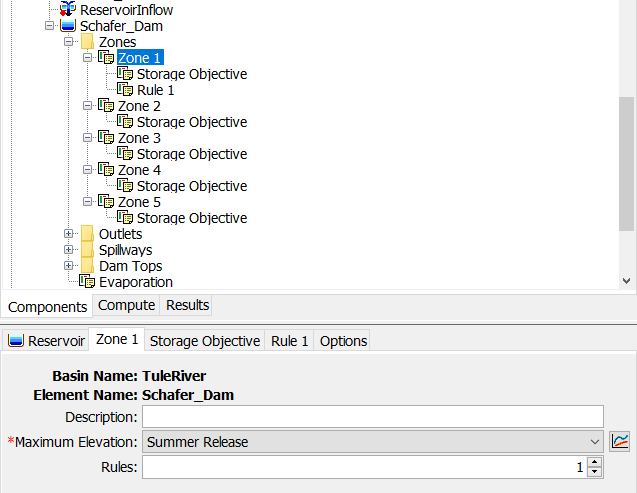
Go to the Storage Objective tab and choose the Minimum Curve storage pattern.

Go to the Rule 1 tab. Choose the Maximum Main Release rule type. Enter a Maximum Release of 600 cfs. Based on the storage pattern, maximum elevation pattern, and rule defined for zone 1, the program will release up to 600 cfs between July 1 and September 30 in order to draw down the reservoir storage to 7,300 acre-ft.

Use the following table to set the required information for zones 2 through 5. Notice how reservoir releases increase as the reservoir storage/elevation becomes greater and greater than the guide curve. The maximum discharge for zone 5 is reduced because most discharge from the reservoir will flow from the uncontrolled spillway when the elevation exceeds 652.5 ft. Many reservoirs operate for locations downstream of the reservoir. HEC-HMS allows you to select elements downstream of the reservoir when setting maximum and minimum flow rules; however, this example only evaluates releases from the reservoir.
Zone
Maximum Elevation Curve
Storage Objective
Rules
1
Summer Release
Minimum Curve
Maximum Main Release = 600 cfs
2
Top of Schedule1
Guide Curve
1) Maximum Rate Flow Change = 250 cfs
2) Maximum Main Release = 500 cfs
3
Top of Schedule2
Guide Curve
1) Maximum Rate Flow Change = 250 cfs
2) Maximum Main Release = 1500 cfs
4
Top of Schedule3
Guide Curve
1) Maximum Rate Flow Change = 250 cfs
2) Maximum Main Release = 2500 cfs
5
Top of Dam
Guide Curve
Maximum Main Release = 0 cfs
(assuming all releases are computed from the spillway and dam top)
- Add two Elevation-Discharge functions to the project, named Minimum and Maximum. These curves will be used to bound the controlled reservoir discharge. The following figure shows the elevation-discharge rating curve for the gated structure at Schafer Dam. Since HEC-HMS will compute gate opening based on the user-defined rules, only the maximum gate opening elevation-discharge curve is used. The minimum elevation-discharge curve is used to define a minimum flow from the reservoir (this discharge will take care of any minimum stream flow requirements).
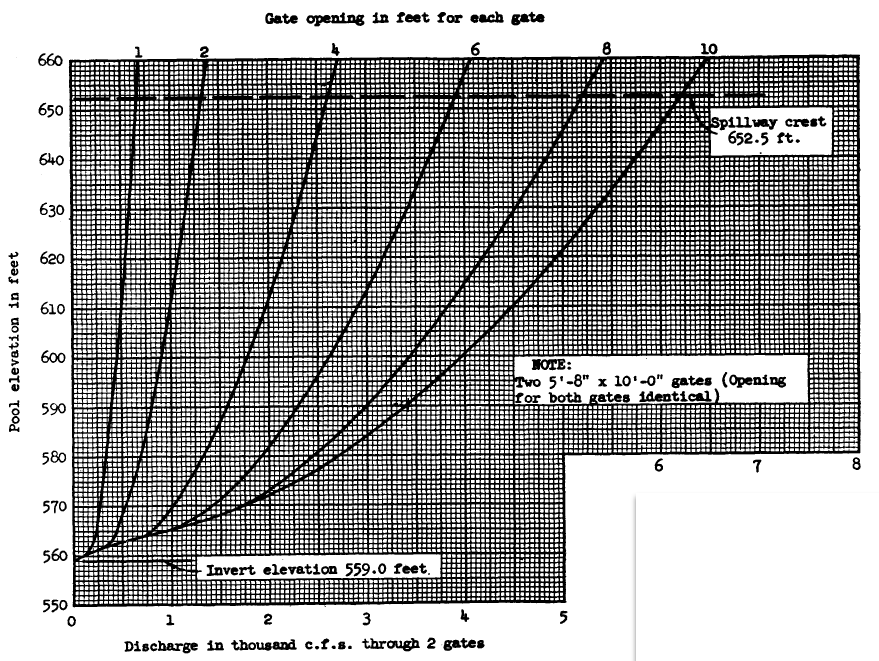
Enter elevation-discharge information shown in the figure and table below into the Maximum table.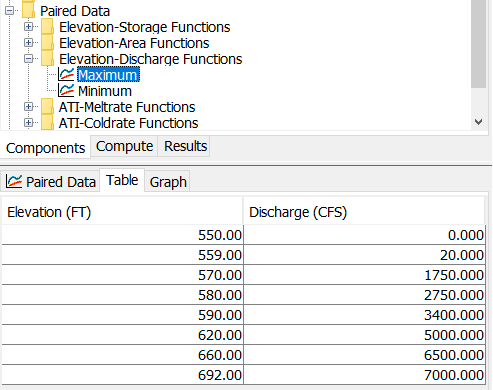
Elevation (ft) Maximum Discharge (cfs) 550.0 0.0 559.0 20.0 570.0 1750.0 580.0 2750.0 590.0 3400.0 620.0 5000.0 660.0 6500.0 692.0 7000.0
Enter elevation-discharge shown in the figure and table below into the Minimum table.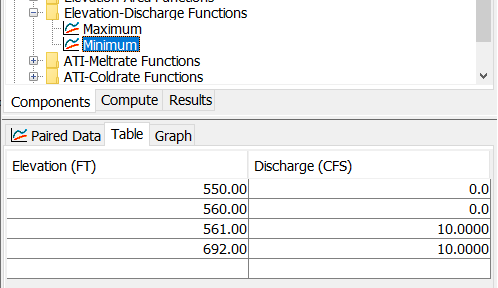
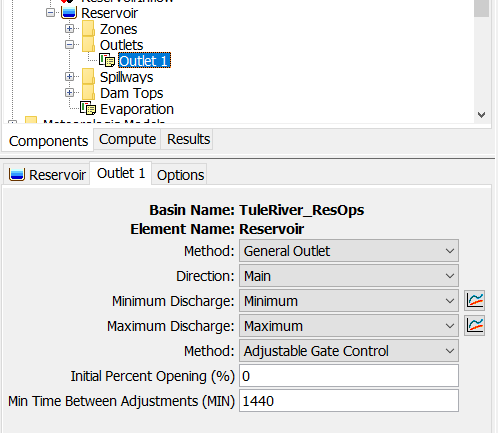
Elevation (ft) Minimum Discharge (cfs) 550.0 0.0 560.0 0.0 561.0 10.0 692.0 10.0 - Go back to the basin model and open the Outlet 1 component editor for the Schafer_Dam element. Set the method to General Outlet. Select the Minimum and Maximum discharge rating curves that you created in the previous step (these bound possible releases from the General Outlet). Choose the Adjustable Gate Control option in order for the program to automatically adjust the gate opening. Enter 0 for the Initial Percent Opening and 1440 (minutes) for the Minimum Time Between Adjustments. The minimum time between adjustments controls the frequency when gate changes are made. Based on the Schafer Dam reservoir operations manual, gate changes are made infrequently.
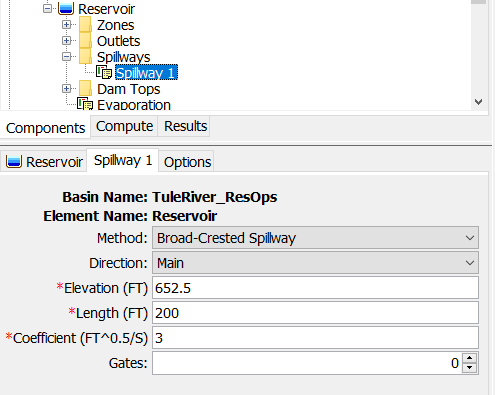
- Open the Spillway 1 Component Editor. Set the spillway invert Elevation to 652.5 ft, the spillway Length is 200 ft, and the Coefficient to 3 FT^0.5/S. This spillway is not gated or operated. Once water reaches the spillway invert, releases are uncontrolled.
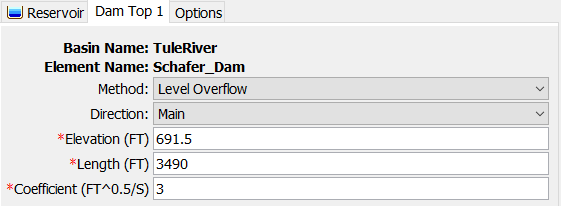
- Open the Dam Top 1 Component Editor. Set the Elevation to 691.5 ft, the Length to 3,490 ft, and the Coefficient to 3 FT^0.5/S.
Open the Evaporation Component Editor. Enter the monthly evaporation amounts in the table below. These values were found in the reservoir operation manual.
Month
Evaporation (inches)
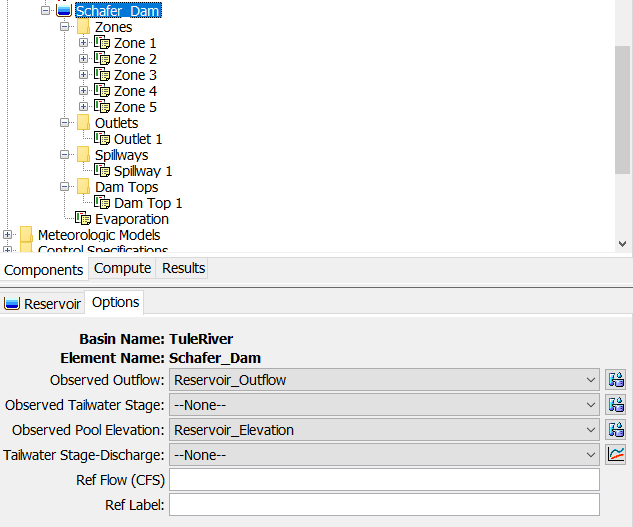
January 1.1 February 1.5 March 2.7 April 4.3 May 6.6 June 8.2 July 10.4 August 10.0 September 7.9 October 5.6 November 2.6 December 1.0 - Open the Options tab for the Schafer_Dam reservoir element. As shown below, choose the Reservoir_Outflow gage for Observed Outflow and the Reservoir_Elevation gage for Observed Pool Elevation.
- Re-run the WY2017-2018 simulation run.
- Open the results graph for the Schafer_Dam element. Remove the Combined Inflow time-series from the plot. Your results should be similar to the figure below. Compare observed and simulated pool elevation and reservoir outflow and answer the questions below.
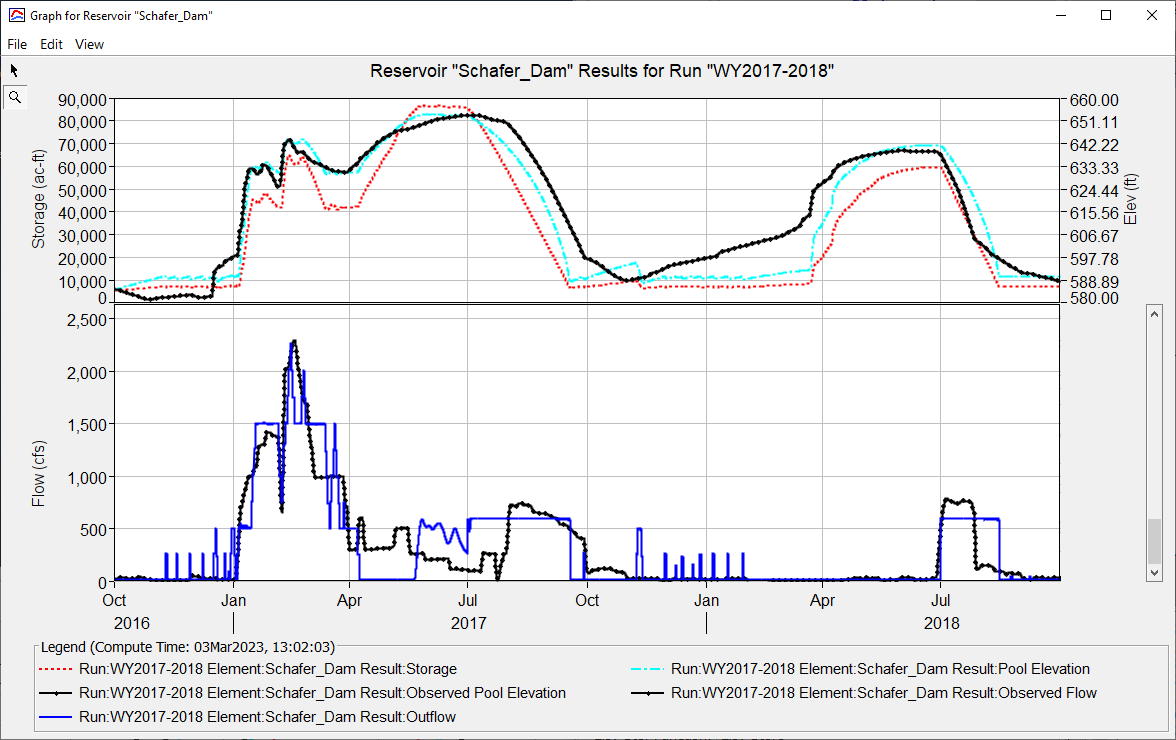
The following figure shows the guide curve using elevation (ft) and the computed reservoir elevation. The black horizontal lines show the elevation for top of schedules 1, 2, and 3.
Questions:
1) What do you notice about observed and simulated reservoir elevation and flow between October 1, 2016 through April 1, 2017?
Between the beginning of the simulation and January 1, 2017, the program makes periodic releases to maintain a reservoir storage of 7,300 acre-ft (approximately 590 ft elevation). January and February 2017 was a wet period. Notice how the reservoir encroaches into schedules 1, 2, and 3 during this period. Since the storage/elevation is above the guide curve, the program used the maximum release rules in zones 2, 3, and 4 to make release decisions to get the storage back to the guide curve. The maximum release rules do a good job approximating actual reservoir operations during this period.
2) What do you notice about observed and simulated reservoir elevation and flow between April 1, 2017 through July 1, 2017?
Notice there is a deviation in observed and simulated reservoir discharge in this period. Between April 8, 2017 and May 20, 2017, reservoir releases were set by HEC-HMS using the minimum discharge for the controlled outlet. This is because the reservoir storage/elevation is below the guide curve. Actual operations are more complicated, it looks like minimum releases are higher in this period, possibly for groundwater recharge. We could add a new zone and elevation pattern to better capture this scenario if it was critical.
3) What do you notice about observed and simulated reservoir elevation and flow between July 1, 2017 through October 31, 2017?
Remember, zone 1 is used to determine releases during the July 1 through October 31 period. Actual operations follow a detailed schedule for irrigation demands. In this example, we approximated irrigation demands by setting the storage target to 7,300 acre-ft and maximum discharge rate of 600 cfs during this period. Since 2017 was such a wet water year, actual irrigation releases were delayed until August.
4) What do you notice about observed and simulated reservoir elevation and flow in the 2018 water year?
Actual operations for the 2018 water year showed that operators encroached into the flood control pool through February 2018. Notice how the HEC-HMS model made periodic releases to keep the reservoir elevation at 590 ft. Water year 2018 was dry with few runoff events. The runoff events in March and April, combined with snowmelt were not enough to fill the reservoir to the top of the guide curve. Summer irrigation releases approximate actual operations after July 1.
Continue to Outflow Curve Option for an HEC-HMS Reservoir Element.
