Last Modified: 2025-06-11 12:59:39.54
This tutorial group demonstrates application of some of the Reservoir routing options in HEC-HMS.
Overview
In this tutorial group you will become familiar with different options within the Reservoir element to simulate reservoir storage, elevation, and releases. This tutorial group contains the following components:
There are questions at the end of each tutorial.
Background
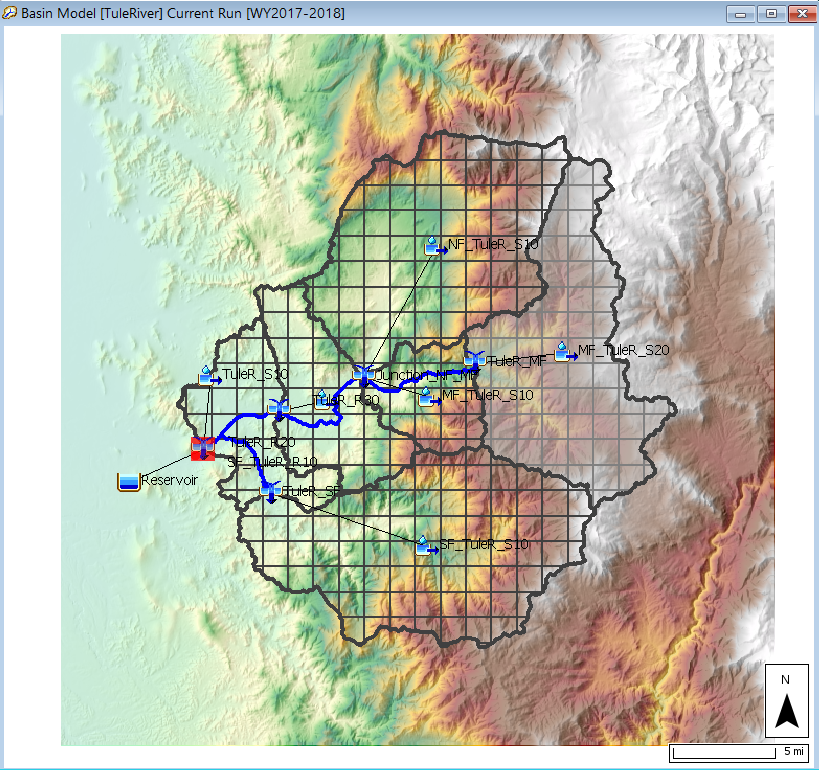
In this tutorial group, you will be working in the Tule River watershed upstream of Success Dam. Success Dam (now commonly known as Schafer Dam) is located upstream of the town of Porterville, California. The watershed is approximately 390 square miles. Elevation ranges from 650 feet at the dam to over 8,000 feet along the watershed boundary. The figure below shows the watershed delineated into six subbasins. One subbasin is highlighted. The MF_TuleR_S20 subbasin is a high elevation subbasin, the average elevation is 6,286 feet, and the drainage area is 85.8 square miles. As shown in the figure below, a 2000-meter discretization was used for all subbasin elements. Gridded precipitation, snow accumulation/melt, and loss computations were performed at each grid cell. Excess precipitation was routed using the ModClark transform method. A fraction of the infiltrated water was returned to the surface using the linear reservoir baseflow method.

The Tule River HEC-HMS model is set up to run a two-year simulation. The Analysis of Period of Record for Calibration (AORC) dataset was used for the meteorologic boundary conditions in this example. This dataset has a period of record of 1979 – present time and can be downloaded from the AORC website - https://hydrology.nws.noaa.gov/pub/aorc-historic/AORC_CNRFC_4km/. The HEC-HMS Gridded Data Importer was used to convert the AORC data to DSS format. Precipitation and temperature grids were added to the HEC-HMS project and linked to the gridded data.
Gridded SWE data was downloaded from https://climate.arizona.edu/data/UA_SWE/ . The University of Arizona SWE dataset was processed using the HEC-HMS Gridded Data Importer and Grid to Point tools. The HEC-HMS Grid to Point tool was only used to process the gridded University of Arizona SWE dataset for the MF_TuleR_S20 subbasin. The subbasin average University of Arizona SWE time-series was added to the HEC-HMS as an "observed" SWE gage and linked to the MF_TuleR_S20 subbasin element.
Observed reservoir inflow, outflow, and reservoir stage were downloaded from the California Data Exchange Center using the CDEC import tool available in HEC-DSSVue. These observations were added to the HEC-HMS project as shown in the figure below.

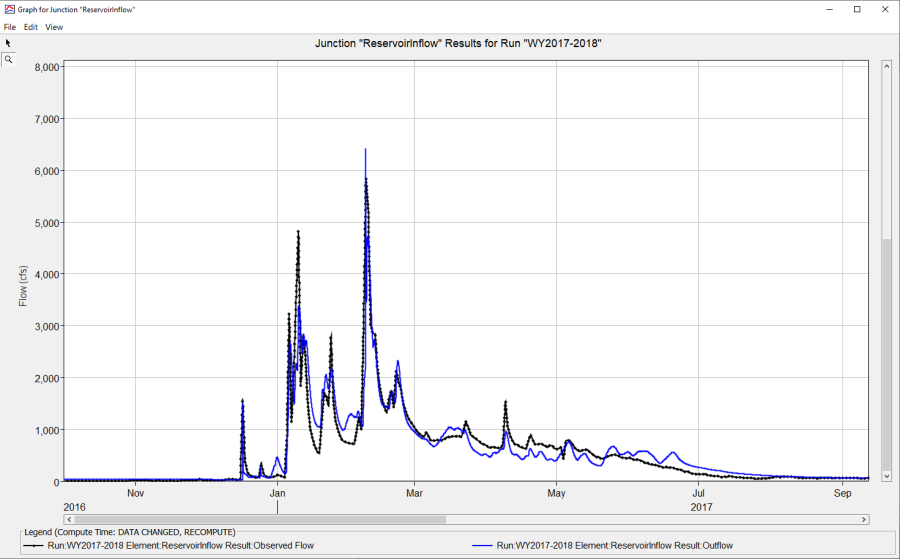
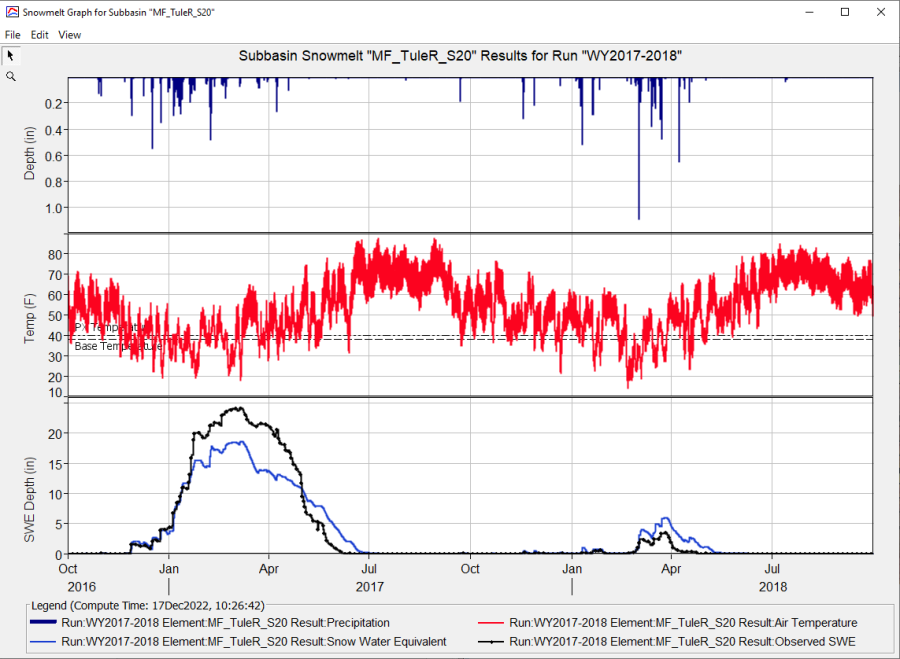
Model parameters were adjusted within reasonable ranges to match observed flow and snowmelt. The first figure below shows computed and observed inflow into the reservoir for the 2017 water year. The observed flow is daily average flow where HEC-HMS results were instantaneous values computed at a 1-hour time step. The second figure below shows HEC-HMS computed SWE and the University of Arizona SWE for the MF_TuleR_S20 subbasin. Trends in the computed and University of Arizona SWE were similar. Given the amount of precipitation from the AORC dataset, the model could not generate the maximum amount of SWE for the 2017 water year. Other model metrics, like the Nash Sutcliff Efficiency score and total volume show good agreement between the model and observations.


Continue to Specifying Releases for an HEC-HMS Reservoir Element