Download PDF
Download page Specifying Releases for an HEC-HMS Reservoir Element.
Specifying Releases for an HEC-HMS Reservoir Element
Return to Introduction to Modeling Reservoir Operations with HEC-HMS.
Last Modified: 2025-06-12 07:42:24.028
This tutorial demonstrates an option for using specified releases (observed discharge) for a reservoir element in HEC-HMS.
Software Version
HEC-HMS version 4.13 beta 6 was used to create this example. You can open the example project with HEC-HMS 4.13 beta 6 or a newer version.Project Files
Download the initial project files here:
 ReservoirExample_SpecifiedReleases_Initial.zip
Overview
In this tutorial you will add a reservoir element to a basin model and configure the reservoir element to use observed discharge as the outflow from the reservoir. We will compare simulated and observed reservoir elevation to evaluate model performance. Observed discharge from the reservoir has already been added to the project along with other data needed to configure the reservoir element and run a simulation. As mentioned in Introduction to Modeling Reservoir Operations with HEC-HMS, the HEC-HMS model for the watershed upstream of the reservoir has been calibrated to the simulation time window used for this tutorial.
- Unzip and open the project.
- Explore the data folders. You should see Reservoir_Inflow, Reservoir_Outflow, and Reservoir_Elevation time-series gages. You can view the data in these gages by clicking on the time-window node in the Watershed Explorer and then selecting the Graph tab. The elevation-storage (Elev-Store) and elevation-area (Elev-Area) paired data curves have already been added to the project as well. Elevation-area is required to model evaporation from a reservoir element.

- Open the TuleRiver basin model and run the WY2017-2018 simulation run. The simulation will take approximately 30 seconds to compute. View results at the ReservoirInflow junction. The calibration metrics show good model performance for the simulation period. It is also important to point out that the observed flow is daily average flow and the HEC-HMS model is simulated using a 1-hour simulation time step (and 1-hour precipitation data).
- Add a reservoir element to the project, named Schafer_Dam. Connect the ReservoirInflow junction to the new reservoir element.
- Open the component editor for the Schafer_Dam element.
- Set the Method to Outflow Structures.
- Choose the Elevation-Storage-Area Storage Method.
- Select the Elevation-Storage Function.
- Select the Elevation-Area Function.
- Choose Elevation for the Initial Condition and enter an Initial Elevation of 585 feet. This is the observed elevation on Oct 1, 2016 at 00:00.
- Select 1 Dam Top.
- Choose Yes for the Release option.
Choose Yes for the Evaporation option.


You could use the Specified Release reservoir routing option instead of Outflow Structures option; however, the Specified Release option does not allow you to model evaporation or other ungaged discharge from the reservoir.
- Expand the Schafer_Dam component in the Watershed Explorer so that you can see the Dam Top 1, Additional Release, and Evaporation nodes.
- Open the Dam Top 1 Component Editor. Set the Elevation to 691.5 ft, the Length to 3,490 ft, and the Coefficient to 3 FT^0.5/S.

- Open the Additional Release Component Editor. Select the Reservoir_Outflow discharge gage (this is the observed discharge from the reservoir).

Open the Evaporation Component Editor. Enter the monthly evaporation amounts in the table below. These values were found in the reservoir operation manual.
Month Evaporation (inches) January 1.1 February 1.5 March 2.7 April 4.3 May 6.6 June 8.2 July 10.4 August 10.0 September 7.9 October 5.6 November 2.6 December 1.0 - As shown below, choose the Reservoir_Outflow gage for Observed Outflow and the Reservoir_Elevation gage for the Observed Pool Elevation.

- Re-run the WY2017-2018 simulation run.
- Open the results graph for the Schafer_Dam element. Your results should be similar to the figure below. Compare the observed pool elevation to the computed pool elevation and answer the questions below.

Questions:
1) What do you notice about observed and simulated reservoir elevation between October 1, 2016 through April 1, 2017?
The simulated reservoir elevation is higher than the observed reservoir elevation from the beginning of the simulation through early December. This difference is due to initial baseflow from the model being slightly higher than actual baseflow. During the period December through April 1, 2017, the computed reservoir elevation matches observed reservoir elevation. This result means the computed inflow into the reservoir is very similar to actual inflow during this period.
2) What do you notice about observed and simulated reservoir elevation between April 1, 2017 through July 31, 2017?
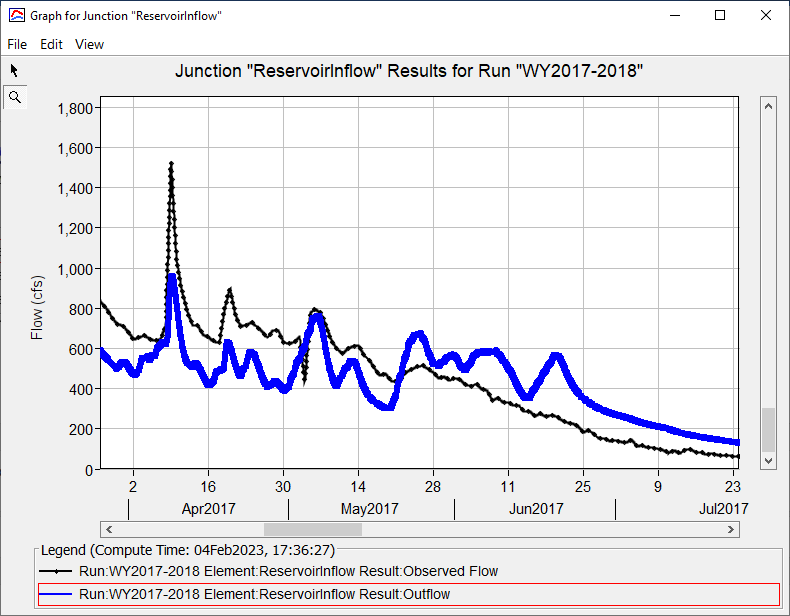
The simulated reservoir elevation is lower than the observed reservoir elevation during most of this period. The figure below shows simulated and observed inflow into the reservoir. Notice that the simulated volume is lower in April and May and then is higher in June and July. These differences explain why the simulation elevation is lower than the observed elevation until the end of this period.
3) What do you notice about observed and simulated reservoir elevation in the 2018 water year?
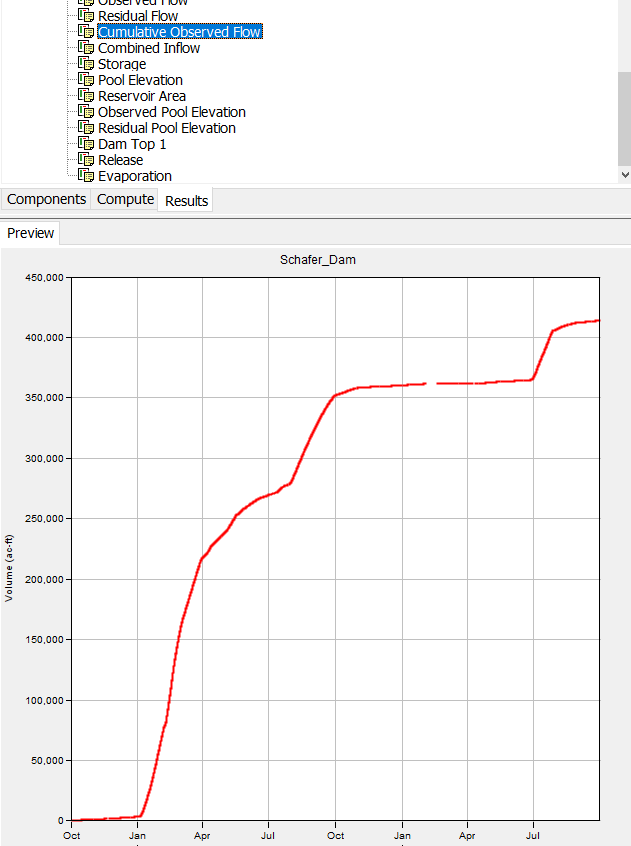
Overall, the simulated reservoir storage and elevation match observations well. One thing to note is that the 2018 water year was a dry water year. When you look at precipitation, SWE, and reservoir inflow, you will notice a significant difference between both of these water years. The figure below shows the measured cumulative inflow into the reservoir for both water years. The 2017 water year had more then 5 times the inflow than the 2018 water year. Therefore, the model will be more sensitive to differences in computed and observed inflow into the reservoir for the 2018 water year since there is less water available. This means baseflow will have a more significant impact in the 2018 water year than the 2017 water year, and you can see this between August, 2018 and the end of the simulation. The computed inflow into the reservoir is slightly higher than observed inflow during this period, which translated to higher reservoir storage/elevation values.
Continue to Rule-Based Option for an HEC-HMS Reservoir Element.