Download PDF
Download page Option 3. Gridded Energy Budget: Upper Truckee River.
Option 3. Gridded Energy Budget: Upper Truckee River
Return to: Introduction to Gridded Snowmelt Calibration
Last Modified: 2024-06-26 07:07:59.083
The most complex snowmelt/accumulation modeling approach within HEC-HMS utilizes a complete energy budget to simulate the growth, evolution, and melt of a snowpack. This method is based upon the Utah Energy Budget Snow Accumulation and Melt Model (Tarboton et al 1995). This method has the ability to potentially outperform the two previously described methods when air temperature and/or net radiation are not the primary sources of energy available for snowmelt (USACE, 1998). For instance, both the Temperature Index and RTI/Hybrid methods do not implicitly include means for incorporating energy from turbulent heat transfer. However, the Energy Budget method suffers from the need for a large amount of meteorological inputs that are not always readily available in most watersheds. Also, this method requires an iterative solution scheme and thus results in longer compute times when compared to the Temperature Index and RTI/Hybrid methods.
Parameterize the Gridded Energy Budget Snow Method
- Right click on the WY2017 Basin Model and click Create Copy....
- Enter WY2017_EB as the name and click Copy.
- Expand the WY2017_EB node and click the UpTruckeeRv_S10 subbasin node.
- In the Component Editor, select the Subbasin tab.
- Change the Snow Method to Gridded Energy Budget.
- Click on the Snow tab.
Enter the following parameter values:
Initial Values: Default

The initial snow states can be set to zero because the simulation will start at the beginning of the WY when there is no snowpack.
- Rain Threshold Air Temperature (F): 37.4
- Snow Threshold Air Temperature (F): 30.2
- Albedo Method: Kondo and Yamazaki (1990)
- New Snow Albedo: 0.85
- Min Snow Albedo: 0.5
- Albedo Refresh Depth (IN): 0.118
- Albedo Decay Method: Fixed Value
- Albed Decay (HR): 96
- Snow Thermal Conductivity (BTU/FT/DEG F/HR): 0.048
- Liquid Water Retention Fraction: 0.05
- Snow Hydraulic Conductivity (FT/S): 0.016
- Soil Depth for Energy Balance (FT): 0.328
Create and Compute a Simulation Run
- Select Compute | Create Compute | Simulation Run....
- Enter WY2017_EB as the name and select Next.
- Select WY2017_EB Basin Model, the WY2017 Meteorologic Model, and the WY2017 Control Specifications.
- Click the Finish button.
- In the Toolbar, select the WY2017_EB simulation from the drop-down menu and click the Compute button.
- When the simulation is complete. navigate to the Results tab.
- Expand the WY2017_EB node and then expand the UpTruckeeRv_S10 subbasin node.
- Select the Observed SWE and Snow Water Equivalent time series nodes to view the results. Alternatively, select the Snowmelt Graph to view Precipitation, Air Temperature, Observed SWE, and Snow Water Equivalent in the same window.
Question 1: Using the initial parameter values, how does your simulated SWE compare with the observed SWE? How will you use the preliminary results to inform your calibration approach?
Snowmelt results are promising. However, the initial computed peak SWE is high when compared against the observed SWE and the computed snowpack melts late, as shown below:

However, the computed discharge does not capture the observed discharge. Therefore, snow parameters need to be modified to improve the calibration agreement.
Calibrate the Gridded Energy Budget Parameters
Revisit the Gridded Energy Budget parameters that you defined in the previous task. Modify the parameters in a systematic way and keep track of the effect of the parameter modifications on the simulated SWE. To assist with calibration, plot the Precipitation, Air Temperature, Observed SWE, and Snow Water Equivalent time series using the Snowmelt Graph. Also, be cognizant of the impact each change has on the computed runoff at the South Lake Tahoe gage location. As such, also plot the computed and observed flow at the SouthLakeTahoe junction.
Attempt to increase the peak SWE by modifying the Rain Threshold Air Temperature and Snow Threshold Air Temperature.
Decreasing the Rain Threshold Air Temperature will cause more precipitation to fall as rain, resulting in a shallower snowpack.
Increasing the Snow Threshold Air Temperature will cause more precipitation to fall as snow, resulting in a deeper snowpack.
- Try reducing the Rain Threshold Air Temperature to 32 deg F and rerun.
- Try increasing the Rain Threshold Air Temperature to 40 deg F and rerun.
- Try increasing the Snow Threshold Air Temperature to 35 deg F and rerun.
- Try decreasing the Snow Threshold Air Temperature to 28 deg F and rerun.
- Continue modifying to best match the peak SWE date and magnitude.
- Attempt to improve the rate at which snow accumulates, melts, and the melt out date by modifying the New Snow Albedo and Min Snow Albedo.
- Try decreasing the New Snow Albedo to 0.8 and rerun.
- Try increasing the New Snow Albedo to 0.95 and rerun.
- Try increasing the Min Snow Albedo to 0.6 and rerun.
- Try decreasing the Min Snow Albedo to 0.1 and rerun.
- Continue modifying the New Snow Albedo and Min Snow Albedo to best match the rate at which SWE accumulates/melts along with the computed melt out date.
- Attempt to improve the rate at which snow accumulates, melts, and the melt out date by modifying the Albedo Decay Coefficient.
- Try increasing the Albedo Decay to 250 and rerun.
- Try decreasing the Albedo Decay to 50 and rerun.
- Continue modifying the Albedo Decay to best match the rate at which SWE accumulates/melts along with the computed melt out date.
- Continue modifying the remaining parameters (e.g. Albedo Refresh Depth, Snow Thermal Conductivity, Snow Hydraulic Conductivity, and Soil Depth for Energy Balance) and note their impact on the computed results.
- Iteratively adjust all impactful parameters to best match peak SWE magnitude, SWE melt rate, melt out date, and runoff at the South Lake Tahoe gage.
Question 2: Which parameters had the largest impact on the computed SWE? How well does the computed SWE compare against the observed SWE?
Rain Threshold Air Temperature, Snow Threshold Air Temperature, New Snow Albedo, Min Snow Albedo, Albedo Decay Coefficient, and Snow Thermal Conductivity are all fairly impactful. During calibration, these parameters should be changed to afford better agreement between computed and observed results. Also, when assessing model uncertainty, these parameters should be analyzed and attempts made to minimize their contributions to the overall project risk.
The computed SWE matches the observed SWE very well.

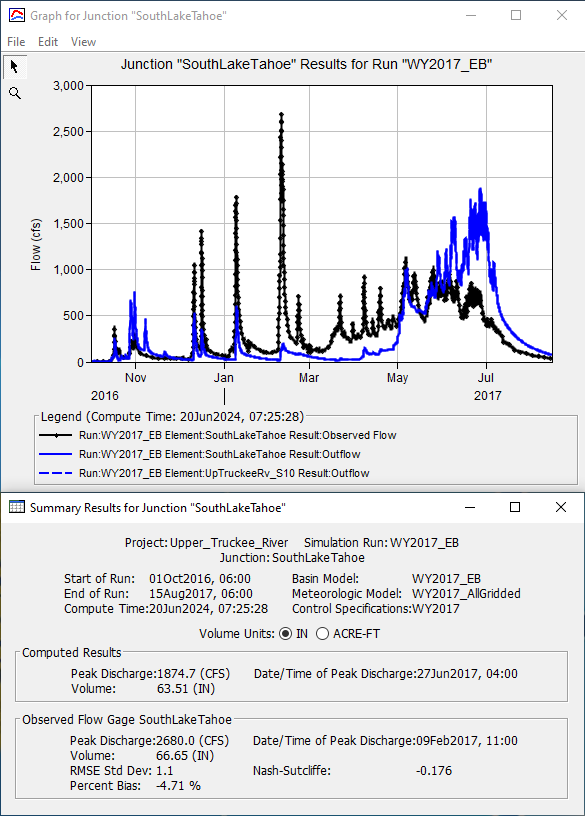
Question 3: How well does the computed runoff at the SouthLakeTahoe junction compare against the observed data?
The computed runoff matches the observed discharge relatively well. However, the computed discharge during the large period of runoff in early Feb 2017 is notably lower than the observed data and the sustained period of runoff in the May-June-July 2017 time frame could be improved. It might be necessary to modify other model parameters or further vary snow parameters and improve flow calibration at the expense of the good SWE calibration results:

Question 4: What were your final Gridded Energy Budget parameters for the Upper Truckee River subbasin?


Continue to: Option 1. Gridded Temperature Index: Upper Truckee River or Option 2. Gridded Hybrid: Upper Truckee River.
This concludes the Calibrating Gridded Snowmelt: Upper Truckee River, California tutorial.