Download PDF
Download page Parameterize the Dynamic Surface Method and Compute a Simulation.
Parameterize the Dynamic Surface Method and Compute a Simulation
In this section, you will parameterize a Basin Model using the Pak and Lee Dynamic Surface method. You will then calibrate the Dynamic Surface method parameters within a continuous simulation of varying lengths (1-10 years). The Canopy, Loss, Transform, and Baseflow parameters have been calibrated to the post-fire period and entered for you.
- Expand the Basin Model folder in the Watershed Explorer and click on the PostFire_DynamicSurface basin model.
- Select the ArroyoSeco_S10 subbasin node.
- Select the Subbasin tab in the Component Editor.
- From the Surface Method drop-down menu, select Dynamic Surface. If a Storage Grid is available, the Gridded Dynamic Surface method could be used with a gridded modeling domain.

- You will be prompted with the following dialog box:
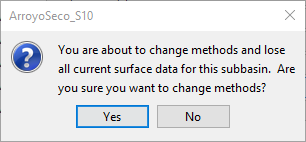
- Since the basin model has no surface data entered, select the Yes button.
- Navigate to the Surface tab in the Component Editor.
- From the Infiltration Method drop-down menu, select the Pak and Lee Infiltration Limit method. Click the Yes button in the dialog box when prompted.
- The following parameters are required to parameterize the Dynamic Surface | Pak and Lee Infiltration Limit method:
- Initial Storage
- Max Storage
- Infiltration Method
- Date of Burn
- Percent Burn
- Initial Rate
- Maximum Rate
- Rain Intensity Threshold
Dry Duration
Pak and Lee Dynamic Surface Parameters
The Initial Storage describes the percentage of the surface storage that is full of water at the beginning of the simulation.
The Max Storage represents the maximum amount of water that can be held on the soil surface before surface runoff begins. The Max Storage is specified as an effective depth of water.
The Initial Rate is the initial loss rate of the surface layer during the first storm event after the burn.
The Maximum Rate is the loss rate that the surface layer recovers to after 10 years.
The Date of Burn and Percent Burn parameters can be found from the Burned Area Emergency Response (BAER) Program and Monitoring Trends in Burn Severity (MTBS) datasets. A tutorial demonstrating calculation of watershed burn severity can be found here: Watershed Burn Severity Calculation Procedure.
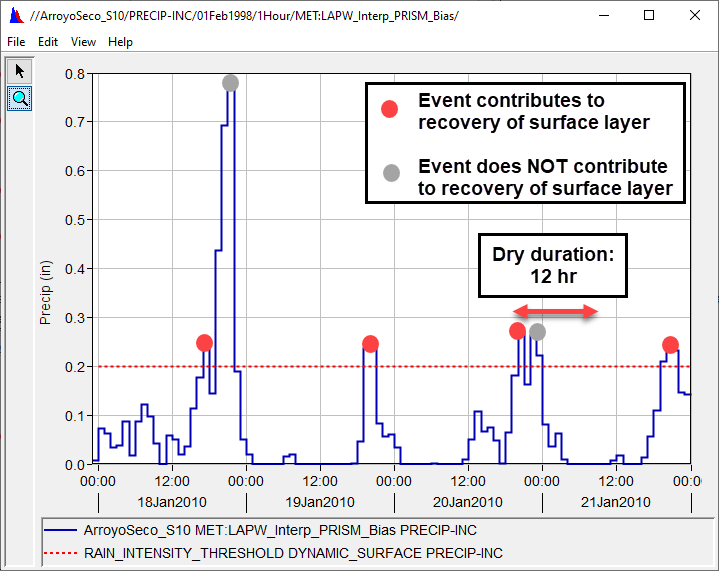
The Dry Duration describes the amount of time required between precipitation events exceeding the Rain Intensity Threshold that must occur in order for the events to contribute to the recovery of the surface layer.
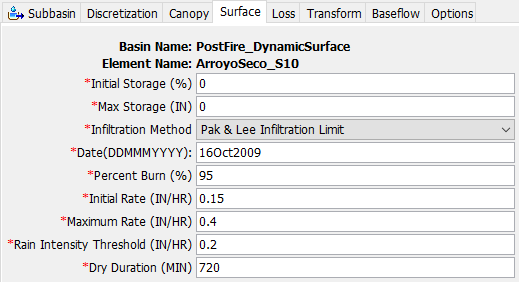
A geospatial analysis using data from the Monitoring Trends in Burn Severity (MTBS) dataset was performed to determine the watershed burn severity. The results of the analysis are tabulated below. Approximately 95% of the watershed was burned. The Station Fire began on 26 August 2009 and was contained on 16 October 2009. In this tutorial, the containment date is used as the Date of Burn.
Burn Severity Classification Area (sq. mi.) Percent of Watershed Area Unburned 0.7 5 Low 2.9 18 Moderate 6.7 42 High 5.8 36 Total Burned 16 95 The Initial Rate was estimated from the calibrated Constant Loss Rate from the January 2010 event (0.15 in/hr). An initial estimate of 0.4 in/hr was used for the Maximum Rate.
Estimating Initial Rate and Maximum Rate
If pre-fire streamflow and precipitation data for the watershed are available, the Maximum Rate can be estimated as the pre-fire Constant Loss Rate. If pre-fire watershed data is not available, the initial estimate of the Maximum Rate should be higher than the Initial Rate. In both scenarios, the Maximum Rate parameter should be refined through calibration.
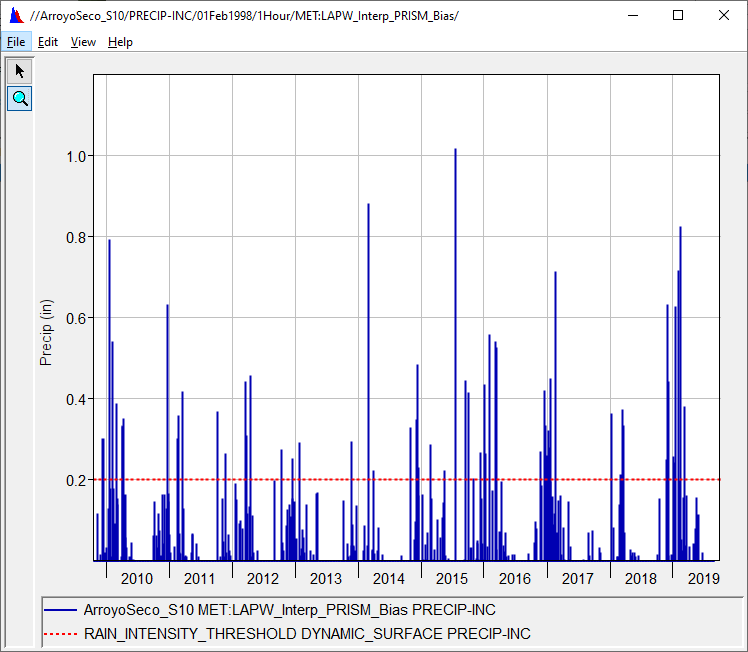
- The Rain Intensity Threshold and Dry Duration parameters were estimated from the hyetograph. A Rain Intensity Threshold of 0.2 in/hr and a Dry Duration of 12 hour (720 min) were used. Both values should be sufficiently high so that minor rainfall events do not contribute to the recovery of the surface layer. However, if the values are too high, the surface layer will recover very slowly. Note that the number of precipitation events exceeding the threshold, rather than the magnitude of precipitation in excess of the threshold, is used in the fire factor computation.
- Enter the parameter values from the previous steps in the Surface Component Editor. The Dynamic Surface Component Editor should appear as in the figure below.
- Navigate to the Canopy tab. Vegetation in the upper Arroyo Seco watershed primarily consists of shrubland (chaparral) with hardwood, oak, pinyon, and connifer trees. The Canopy layer Initial Storage and Max Storage were set to 0% and 0 in, respectively. A Crop Coefficient time-series gage was specified to simulate vegetation regrowth post-fire. The crop coefficient was set to 0 for the first year post-fire since the vegetation was burnt, resulting in little to no canopy coverage. Vegetation regrowth was modeled by linearly increasing the crop coefficient over a 6 year period, as indicated by post-fire monitoring.
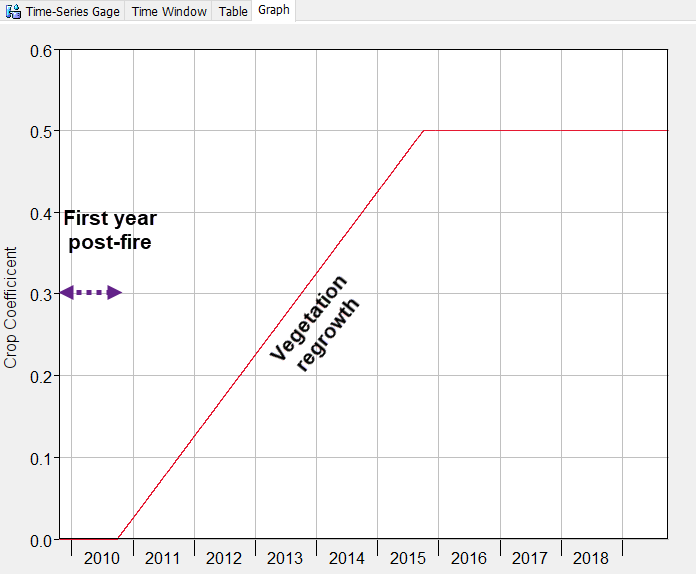
Post-fire Vegetation Regrowth
The rate of vegetation regrowth post-fire depends on many factors, including climate, soil type, vegetation type, and fire severity. The rate of recovery will vary by watershed and by fire.
The Canopy Component Editor is shown below.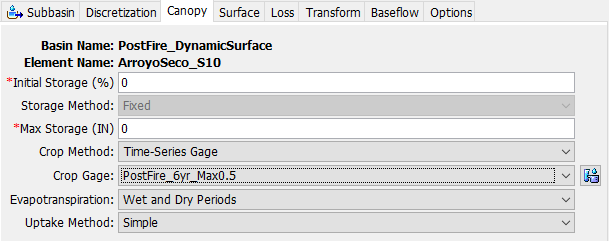
- Navigate to the Loss tab. The Loss Component Editor should appear as in the figure below. Notice that the Constant Loss Rate and the Dynamic Surface Maximum Rate are the same (0.4 in/hr). When the surface layer has fully recovered, the surface and soil layers act as one layer with a single loss rate.

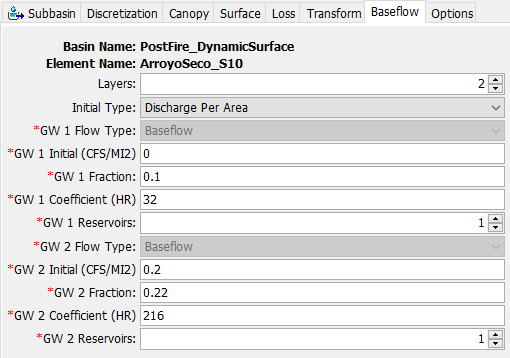
- Navigate to the Baseflow tab. The Baseflow Component Editor should appear as in the figure below. The GW Fractions and GW Coefficients were calibrated for use in long-term simulations.
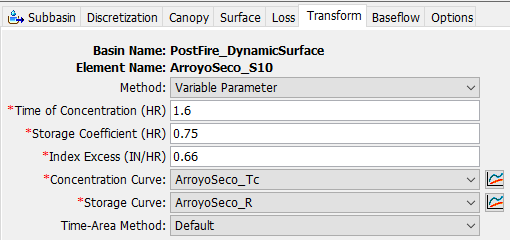
- Navigate to the Transform tab. The Transform Component Editor should appear as in the figure below. These parameters were not adjusted from the January 2010 simulation.
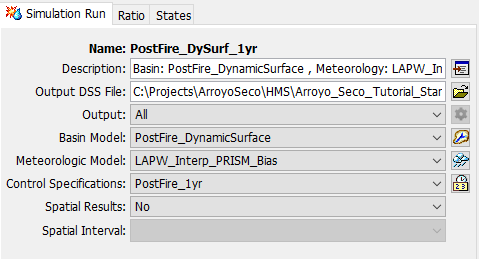
- Create a Simulation Run by selecting Compute | Create Compute | Simulation Run. Name the run PostFire_DySurf_1yr and select the Next button. Select the PostFire_Dynamic Surface basin model, the LAPW_Interp_PRISM_Bias meteorologic model, and the PostFire_1yr control specifications on the following screens. Select the Finish button.
- Select the Compute tab in the Watershed Explorer and expand the Simulations Runs folder in the Watershed Explorer. Select the PostFire_DySurf_1yr simulation run. Check that the simulation settings match the figure below.
- Select the PostFire_DySurf_1yr simulation from the Compute Selection Box in the Toolbar, as shown below.

- Click the Compute button
 to run the simulation.
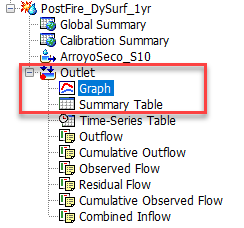
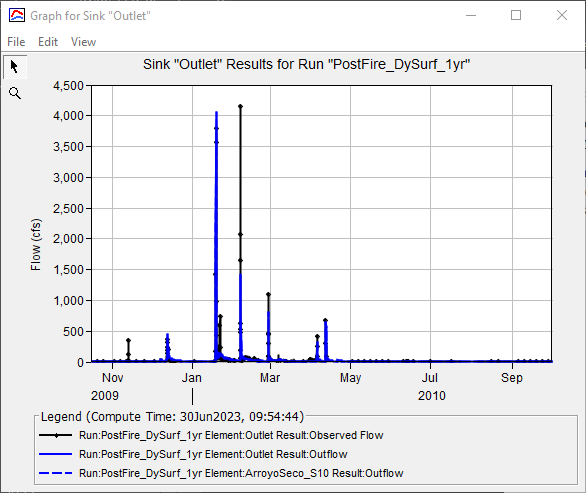
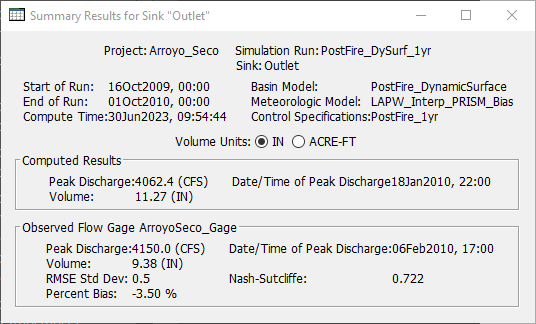
 - Select the Results tab. Expand the Simulations folder and the PostFire_DySurf_1yr node. Expand the node for the Sink element named Outlet and select the Graph and Summary Table nodes to view the results. The results should look similar to the figures below.
- Keep the Graph and Summary Table open to assist with calibration in the next task.
Continue to Calibrate the Dynamic Surface Method Parameters.