Download PDF
Download page Apply a Peaking Factor to the Unit Hydrograph.
Apply a Peaking Factor to the Unit Hydrograph
HEC-HMS version 4.12-beta.5 was used to create this tutorial. You will need to use HEC-HMS version 4.12, or newer, to open the project files.
Based on Engineering Regulation 1110-8-2(FR), Inflow Design Floods for Dams and Reservoirs, unit hydrograph inflows must be peaked to account for the non-linearity observed in real flood events. We will now peak the 2004 unit hydrograph for a PMF analysis.
- Continue using the project from the previous tutorial: Compute a Synthetic Unit Hydrograph for Several Historical Events.
- Make a copy of the 1972 Bald Eagle Calibration basin model and call it 2004 Bald Eagle Basin.
- Set the Clark Unit Hydrograph parameters in the Bald Eagle Basin element to Tc = 10 hours and R = 8 hours (these parameters were set based on calibration to the 2004 unit hydrograph).
- Go to the Options tab and set the Observed Flow to "None" since we are no longer calibrating.
- Create a new simulation named 1-inch 1 hour (2004).
- Select the correct basin model, meteorologic model, and control specification for the new simulation.
- Under Meteorologic Models in the Components tab include the 2004 Bald Eagle Basin basin model on the Basins tab of the 1-inch Precip 1 hour meteorologic model.
- Run the 1-inch 1 hour UH (2004) simulation.
- Create a copy of the 2004 Bald Eagle Basin basin model and name it 2004 Bald Eagle Basin 25P. This copy will be used to peak the unit response at the dam by 25 percent.
- Create a new simulation named 1-inch 1 hour UH (2004) 25P using the 2004 Bald Eagle Basin 25P basin model, 1-inch Precip 1 hour meteorologic model, and Time Window control specifications.
- Make sure to update the 1-inch Precip 1 hour meteorologic model so that it is linked to the Bald Eagle Basin 25P basin model (go to the Basins tab within the meteorologic model editor).
Run the 2004 Bald Eagle Basin 25P simulation and adjust the Tc and R parameters using the same scaling factor so that the unit hydrograph peak is scaled by 25 percent (i.e. unit hydrograph peaking).
The Tc parameter controls the hydrograph timing and the R parameter controls the hydrograph shape (but also timing to some degree).
Both parameters are influenced by similar watershed characteristics, slope, flow path, roughness, and storage to name a few.
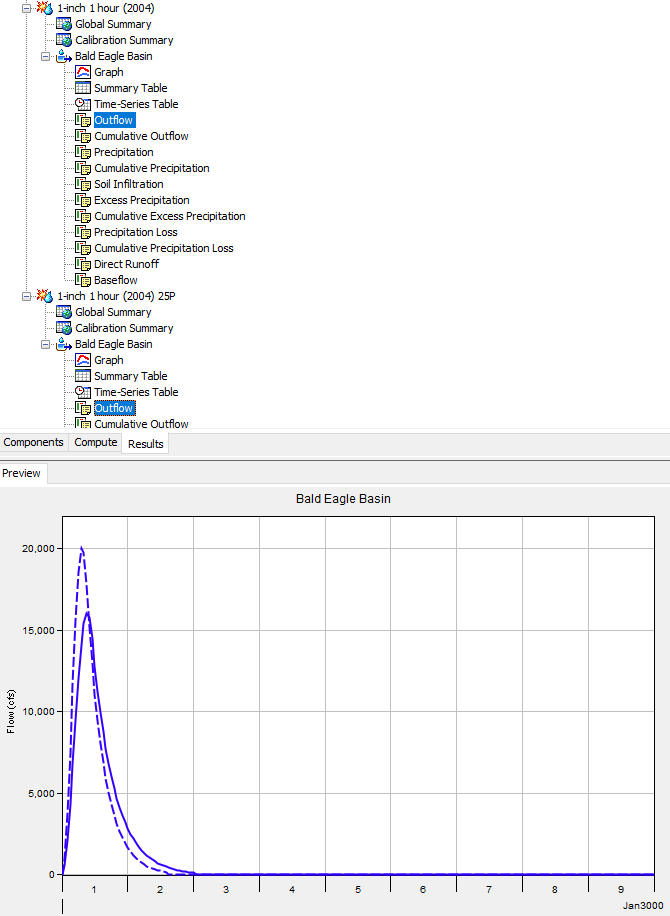
The peak flow of the 2004 event unit hydrograph was approximately 16,000 cfs.
Thus, a 25-percent peaked unit hydrograph for the 2004 event should have a peak flow of approximately 20,000 cfs.

You can easily compare hydrographs from two simulations by clicking on results time-series on the Results tab of the Watershed Explorer (hold down the control key to add multiple time series to the same plot). You can also compare peak flows by opening the Summary Table for both simulations.
Question 4: What are your final Tc and R parameters that peak the unit hydrograph by approximately 25 percent?
7.92 and 6.34 hours respectively. The below figure shows the 2004 1-hour unit hydrograph (solid line) peaked by 25 percent (dashed line). Set your Clark Parameters in the 2004 Bald Eagle Basin 25P basin to Tc = 7.92 and R = 6.34 so your results match.
During a PA, you would also peak the unit hydrograph by 50 percent. Multiple PMF simulations are required for the PA that evaluate scenarios of no peaking, 25 percent peaking, and 50 percent peaking.
Add losses and baseflow to both 2004 basin models.
Select the Initial and Constant loss method and the Recession baseflow method.
Using information in the current Sayers Dam reservoir regulation manual, losses should be very low.
The spillway design flood assumed 2.75 inches of losses (for a 48-hour event), which is approximated using a relatively small initial loss of 0.2 inches and a constant loss around 0.05 inches per hour.
In the Loss tab, set the Initial Loss to 0.2 inches and the Constant Loss Rate to 0.05 inches per hours within the loss editor.
The Impervious Area should be 1.6 percent (the reservoir area is 5.4 square miles when the reservoir elevation is at the spillway invert).

If the drainage area of the lake is significant in relation to the watershed area, then a higher percent impervious area scenario could be included (to reflect the surface area in between the starting pool and full pool).
In the Baseflow tab, set the Initial Type to Discharge, Initial Discharge to 300 cfs, Recession Constant to 0.6, and the Ratio to Peak to 0.05.
It is important that baseflow parameters are defined so that baseflow is a very minor portion of the total runoff hydrograph. Since losses are low, most runoff will be direct runoff (overland flow). It is always important to check the total runoff volume and make sure the total runoff volume is less than the precipitation volume.
- Add a new Precipitation Gage named PMP Gage to the project and add the PMP time series.
- The HMR 52 PMP was computed in another workshop and was entered manually as an hourly time series record.
- Create a new meteorologic model named PMP Event.
- Set the Replace Missing option to Set to Default and select the Specified Hyetograph precipitation method.
- On the Basins tab, make sure the meteorologic model is linked to both PMF basin models.
- Then go to the Specified Hyetograph editor and select the PMP Gage for the Bald Eagle Basin subbasin element.
- Create two simulations.
- Use descriptive names when creating the simulation runs like PMF No Peaking and PMF Peak 25P.
- Both simulations will use the PMP Event meteorologic model and Time Window control specifications.
- One simulation will use the 2004 Bald Eagle Basin basin model and the other will use the 2004 Bald Eagle Basin 25P basin model.
During a PA, a 50 percent unit hydrograph peaking scenario should also be included.
Run the simulations and compare the PMF hydrographs.
Question 5: What is the difference in Peak Flow and Runoff Volume between the non-peaking and 25% peaking simulation runs?No Peaking: peak flow = 269,400 cfs, volume = 24.2 in.
25% Peaking: peak flow = 320,400 cfs, volume = 24.7 in.
The below figure shows the original Spillway Design Flood (SDF) for Sayers Dam.
The SDF contained 21.8 inches of precipitation in 48 hours.
The peak flow is approximately 251,000 cfs and the runoff volume is 19.05 inches.

Question 6: How are the current PMF simulations different than the original SDF?
The updated PMF increased in both peak flow and volume when compared to the SDF. The peak flow increased from 251,000 cfs to 269,400 and 320,400 cfs using updated procedures. The direct runoff value also increased from 19.05 to 21.8 inches. This illustrates that it is very important to update unit hydrographs and PMPs for Periodic Assessments.
Question 7: What is the benefit of fitting a model to the basin unit hydrograph?
Fitting a model to the basin unit hydrograph allows you to run the simulation with time steps that do not equal the duration of the unit hydrograph. While HEC-HMS will change the duration of the Specified Unit Hydrograph when the time step of simulation is changed, the conversion does not always produce a realistic unit hydrograph. This is illustrated in the Standardize Unit Hydrographs to a 1-Hour Duration Using the S-Graph Method tutorial where converting the 20-hour UH to a 1-hour duration produced unrealistic results. Using a synthetic method like the Clark Unit hydrograph avoids these issues.
Summary
This workshop walked through a quick method for developing a simple hydrology model to simulate the PMF. The approach presented is a good option when no existing detailed models are available and when only a short amount of time is available to determine the PMF using the most recent HMR.
Download the final model files here:

This page concludes the Estimating the PMF Starting with No Existing Model tutorial group. However, an optional task can also be completed (if time allows): Standardize Unit Hydrographs to a 1-Hour Duration Using the S-Graph Method.