Download PDF
Download page Using the ARkStorm 2.0 Meteorology within HEC-HMS.
Using the ARkStorm 2.0 Meteorology within HEC-HMS
Introduction
This tutorial demonstrates how ARkStorm 2.0 data can be obtained, imported, and used within HEC-HMS. This tutorial also presents outputs from simulations for several watersheds within the state of California.
This information is meant for demonstration purposes only and does not constitute an official U.S. Army Corps of Engineers report.
Background
ARkStorm 1.0
The U.S. Geological Survey (USGS) Multi Hazards Demonstration Project (MHDP) devised several hypothetical scenarios that were meant to engage emergency planners, businesses, universities, government agencies, and others in preparing for major natural disasters. The first publicly available product they produced, termed the "ShakeOut Earthquake Scenario", was published in May 2008 (Jones et al, 2008). The ShakeOut Scenario depicts a hypothetical magnitude 7.8 earthquake along the San Andreas Fault in southern California and resulted in the largest earthquake drill in U.S. history. The second publicly available product produced by the MHDP was a hypothetical winter storm scenario hereafter referred to as "ARkStorm 1.0". The scenario was based on repeated historical events that were documented in geologic and historical records that were analogous to those that devastated California in 1861-1862 and with magnitudes projected to become more frequent and intense as a result of climate change. The ARkStorm 1.0 event was patterned after the 1861-1862 historical events but used modern modeling methods and data from large storms in 1969 and 1986 (Porter et al, 2010).
ARkStorm 2.0
Building upon the ARkStorm 1.0 effort, an updated version of the ARkStorm scenario was created and is hereafter referred to as "ARkStorm 2.0" (Huang and Swain, 2022). The ARkStorm 2.0 events were designed using two separate scenarios: 1) one drawn from the recent historical climate (circa 1996–2005; hereafter referred to as “ARkHist”) and 2) another from a hypothetical warmer future climate (2071–2080 in the “high warming” Relative Concentration Pathway (RCP) 8.5 emissions scenario; hereafter referred to as “ARkFuture”). Each scenario was comprised of a multi-week sequence of consecutive severe winter storm events similar to that which was reported to have occurred during the peak of the 1861-1862 flood event. Specific events were selected for inclusion in the ARkStorm 2.0 scenario by ranking the 30-day cumulative precipitation on a California statewide basis simulated by the 40-member Community Earth System Model Large Ensemble (CESM1-LENS; Kay et al, 2015). The top 3 ranked events in each climate era were then chosen to dynamically downscale using a high-resolution weather model (the Weather Research and Forecasting, WRF, model v4.3; Skamarock et al, 2019). The large-scale prevailing conditions during the ARkHist and ARkFuture scenarios are shown in Figure 1.
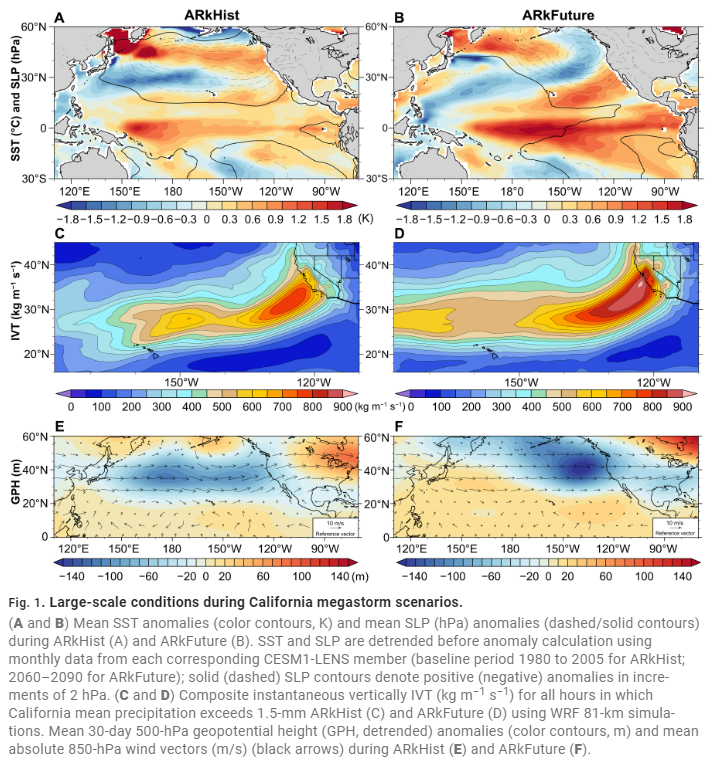
The ARkStorm 2.0 data can be visualized through an interactive viewer located here: https://dri-apps.earthengine.app/view/arkstorm.
HEC-HMS Projects
Three previously constructed HEC-HMS projects were chosen to demonstrate the usage of the ARkStorm 2.0 meteorology. These projects were updated within this effort to facilitate improved accuracy as well as reduce computation times. A description of each project is contained in the following paragraphs.
Sacramento and San Joaquin River Watersheds
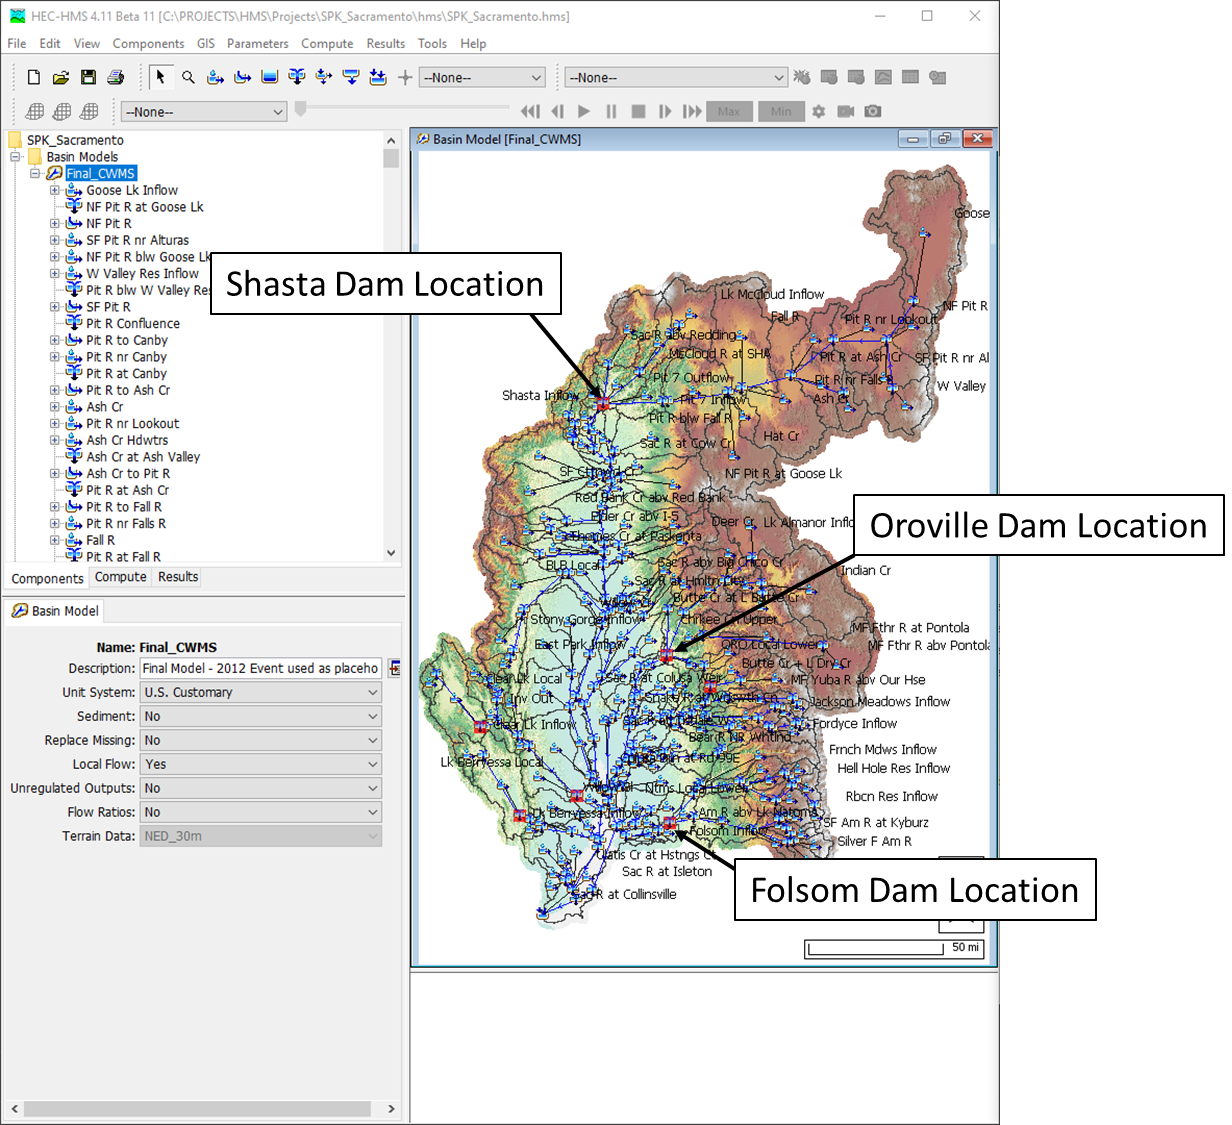
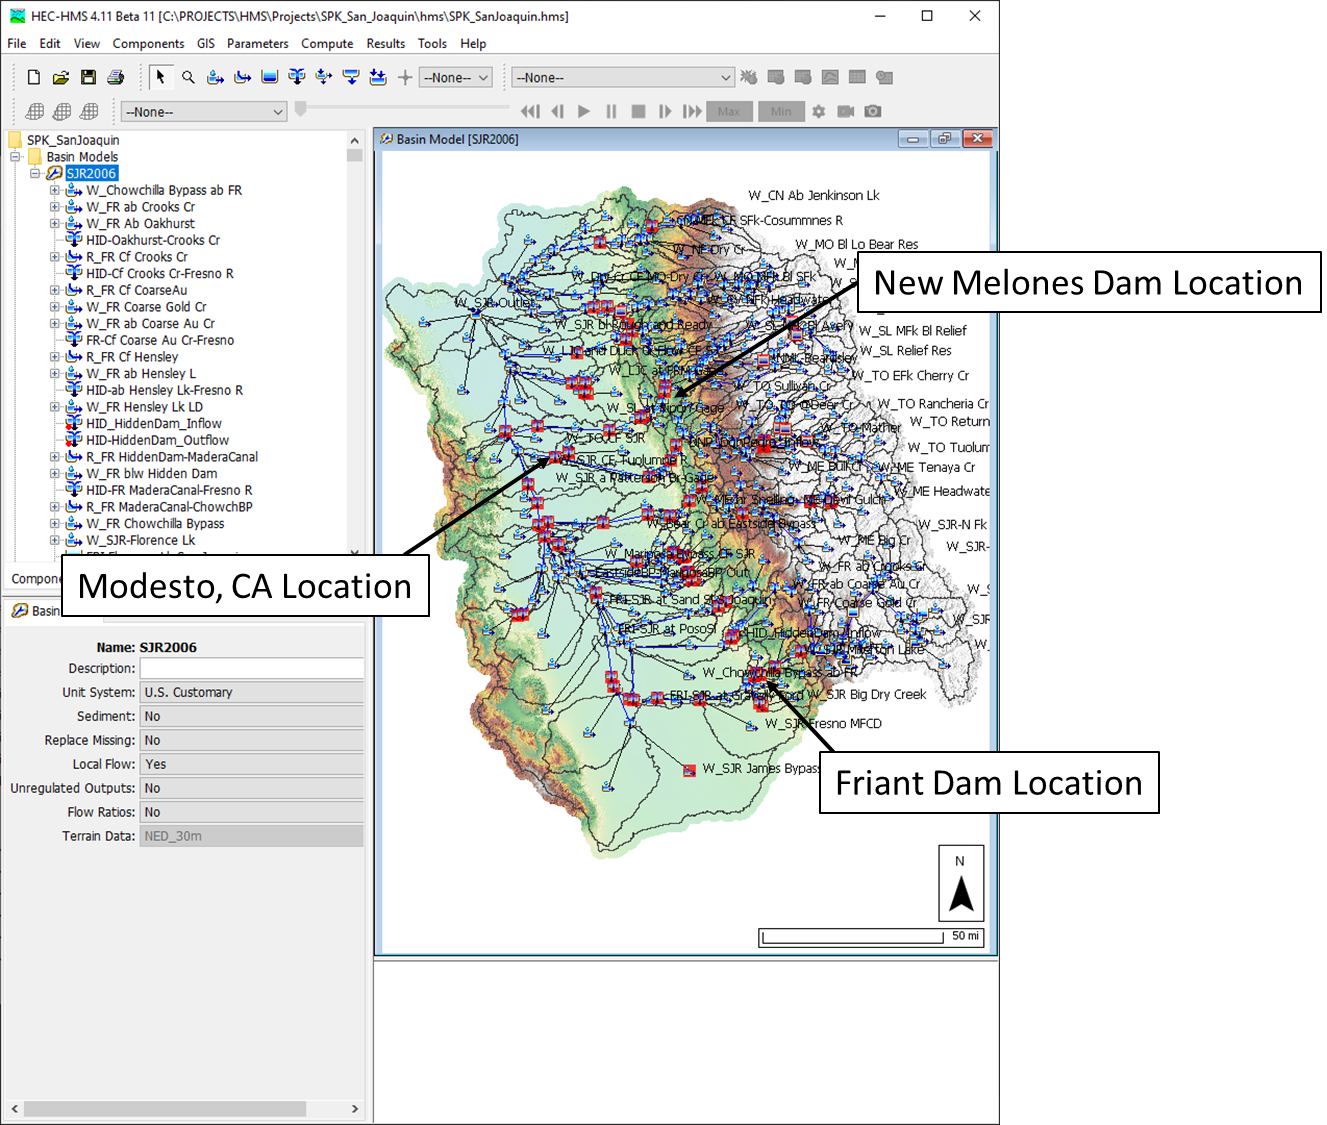
Two HEC-HMS projects, one encompassing the Sacramento River watershed and another encompassing the San Joaquin River watershed, were chosen for use. These two HEC-HMS projects were originally created as part of the Sacramento and San Joaquin River Comprehensive Study (HEC, 2001). The layouts of the Sacramento River and San Joaquin River HEC-HMS projects in relation to pertinent locations are shown in Figure 2 and Figure 3, respectively.
Truckee River Watershed
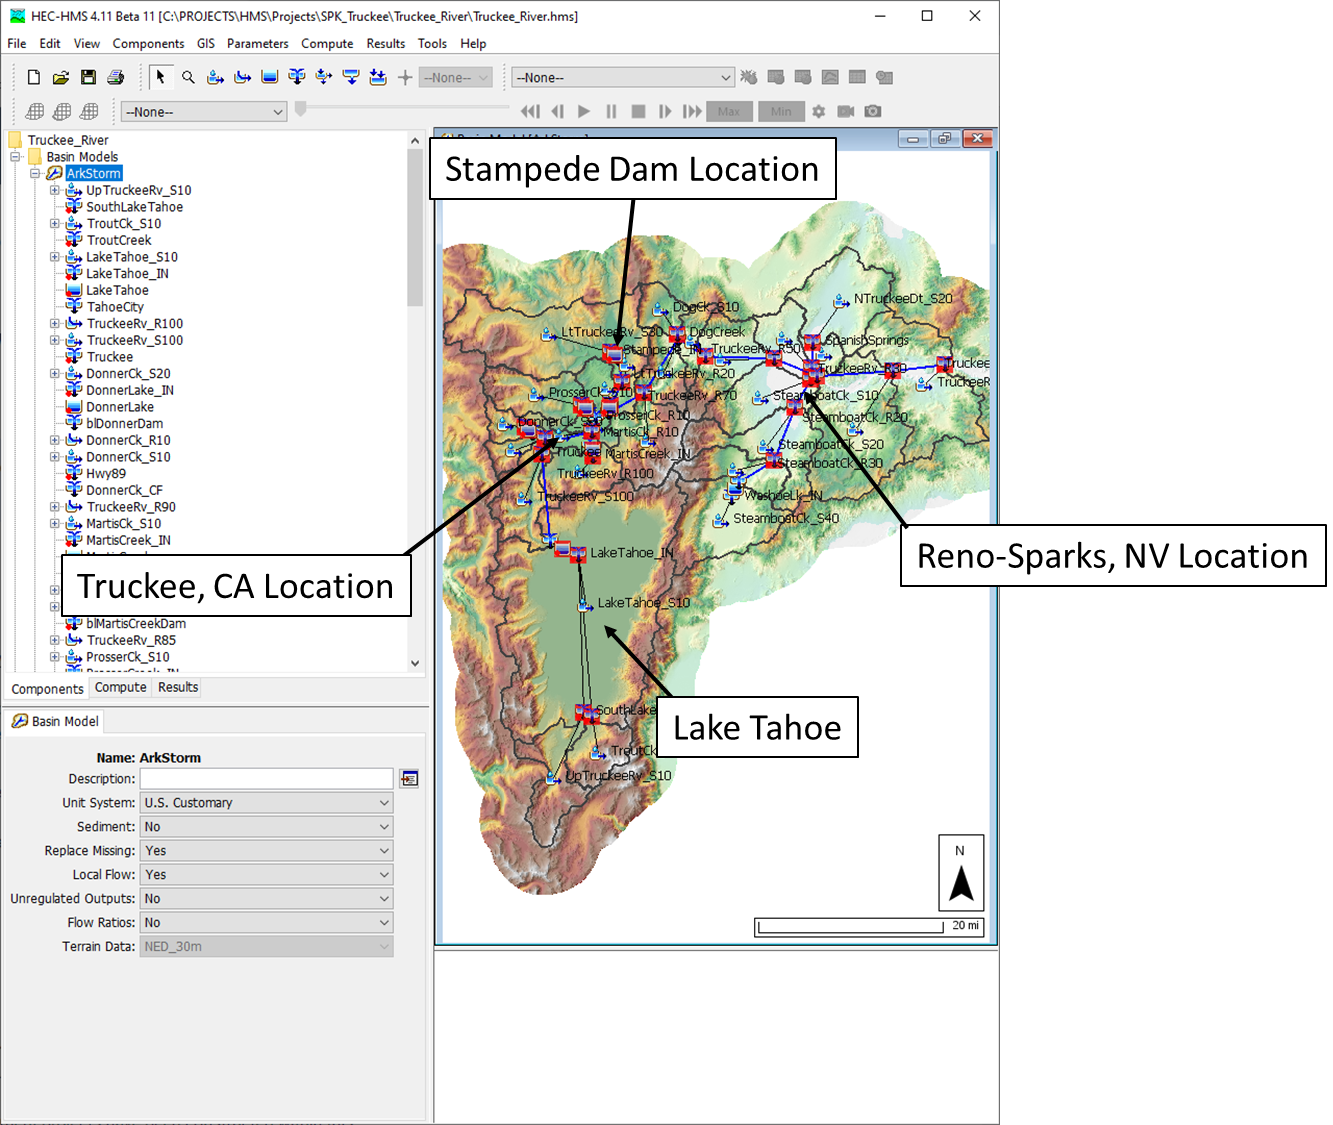
An HEC-HMS project was developed to evaluate new snowmelt and 2D flow methods within the Truckee River watershed. This HEC-HMS project originated from the Truckee River Corps Water Management System (CWMS) implementation (USACE, 2015). The layout of this HEC-HMS project is shown in Figure 4.
Using the ARkStorm 2.0 Meteorology within HEC-HMS
The ARkStorm 2.0 meteorology is distributed within NetCDF files and can be efficiently imported for use within HEC-HMS (once reformatted; see below). Detailed steps to import and format NetCDF data as well as configure the requisite modeling elements within HEC-HMS is detailed within several tutorials located here: Working with Gridded Boundary Condition Data.
The data available through Huang and Swain, 2022 must be reformatted to remove the variable length x-axes within each data set prior to use within HEC-HMS. This has been done for you and the resultant, correctly formatted data can be downloaded using the link presented above.
Results
Once the ARkStorm 2.0 data was imported to each of the aforementioned HEC-HMS projects, simulations were computed to estimate outputs. The following paragraphs describe results obtained by applying the ARkFuture scenario to the aforementioned HEC-HMS models. In general, the ARkFuture scenario results in significantly more runoff than the ARkHist scenario. The ARkFuture scenario was assumed to occur from 11Jan2072 - 09Feb2072. Finally, the ARkFuture simulation was run using a 1-hour computational time step in all three models.
Initial conditions (e.g., antecedent soil moisture, snow water equivalent, etc.) were assumed equivalent to those prevailing prior to the January 1997 flood event in all three models. Also, parameters achieved through calibration using the January 1997 flood event were used in all three models.
Sacramento River
Within the upper Sacramento River, Feather River, Yuba River, and American River watersheds, nearly 100 inches of cumulative precipitation is estimated to fall during the ARkFuture scenario. It should be noted that not all of this precipitation fell as rain; some of this precipitation is converted to snow water equivalent (SWE). However, in general, elevated air temperatures are prevalent throughout the Sacramento River watershed. In some cases, they exceeded 80 deg Fahrenheit for brief periods of time. When combined with the assumed January 1997 antecedent conditions, the application of the ARkFuture scenario resulted in nearly 70 inches of runoff being generated over the upper Sacramento River, Feather River, Yuba River, and American River watersheds. Videos of cumulative precipitation, SWE, and cumulative excess precipitation within the Sacramento River when subjected to the ARkFuture scenario are shown below.
Unregulated discharge hydrographs at various locations of interest are shown below.
In this tutorial, the term "unregulated" refers to the conditions that would exist with no upstream regulating structures, levee failures, etc. The Sacramento River watershed is heavily regulated by numerous large dams, diversions, bypass channels, etc. that are operated in a coordinated manner to reduce flood risks to people and property.
In an effort to simplify this analysis, all regulating structures (e.g., Folsom Dam, etc.), bypass channels (e.g., Yolo Bypass), levees, and other man-made structures were removed from this model. While simplified, this allows for faster computations while still allowing for outputs to be compared to conditions during historical floods (e.g. January 1997).
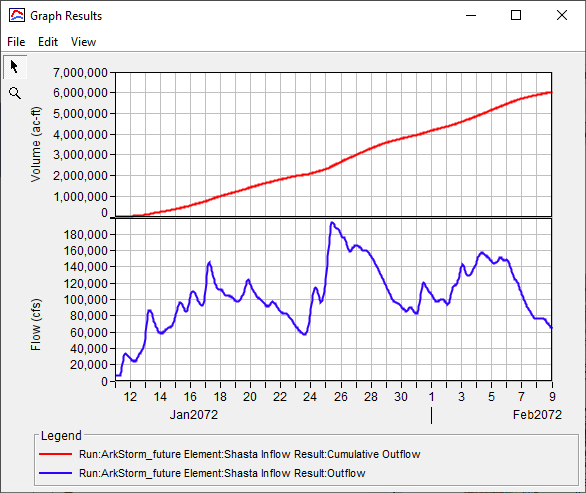
Shasta Dam Location Results
The computed unregulated inflow to Shasta Dam is shown in Figure 5. For reference, the estimated peak unregulated inflow during the January 1997 flood event at this location was approximately 240,000 cfs (USGS, 1998), which is approximately 60,000 cfs larger than that which was predicted using the ARkFuture scenario. The computed unregulated runoff volume of approximately 6 million ac-ft achieved within this simulation is approximately 32% larger than the gross storage volume of 4.552 million ac-ft at Shasta Dam. Significant reservoir releases would likely accompany such a large inflow event thereby increasing the effectiveness of the available storage afforded by Shasta Dam.
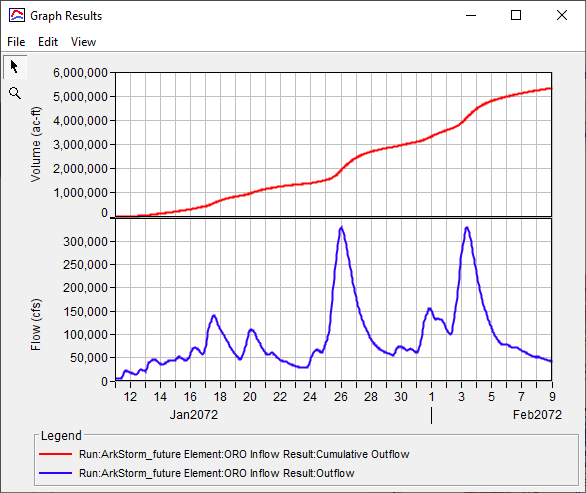
Oroville Dam Location Results
The computed unregulated inflow to Oroville Dam is shown in Figure 6. For reference, the estimated peak unregulated inflow during the January 1997 flood event at this location was approximately 300,000 cfs (USGS, 1998), which is approximately equivalent to that which was predicted using the ARkFuture scenario. The computed unregulated runoff volume of approximately 5.25 million ac-ft achieved within this simulation is approximately 50% larger than the gross storage volume of approximately 3.54 million ac-ft at Oroville Dam. Significant reservoir releases would likely accompany such a large inflow event thereby increasing the effectiveness of the available storage afforded by Oroville Dam.
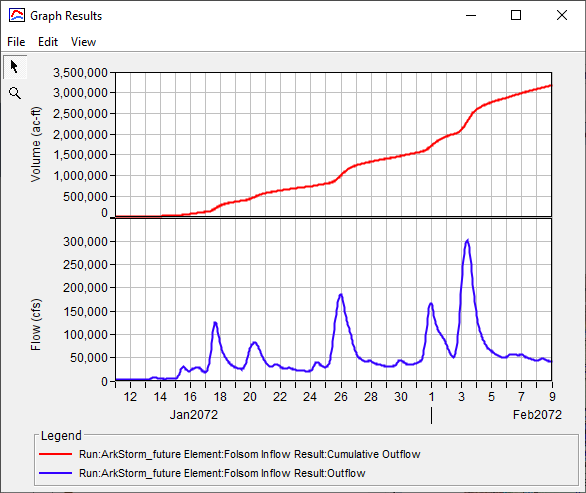
Folsom Dam Location Results
The computed unregulated inflow to Folsom Dam is shown in Figure 7. For reference, the estimated peak unregulated inflow during the January 1997 flood event at this location was approximately 300,000 cfs (USBR, 2002), which is approximately equivalent to that which was predicted using the ARkFuture scenario. The computed unregulated runoff volume of approximately 3.25 million ac-ft achieved within this simulation is approximately 240% larger than the gross storage volume of approximately 967,000 ac-ft at Folsom Dam. Significant reservoir releases would likely accompany such a large inflow event thereby increasing the effectiveness of the available storage afforded by Folsom Dam.
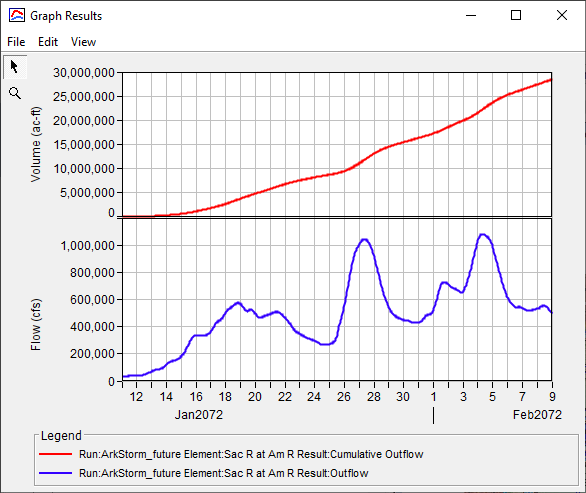
Sacramento River at the American River Confluence Results
The computed unregulated flow at the Sacramento River and American River confluence (inclusive of the American River flow) is shown in Figure 8. For reference, the estimated combined peak unregulated flow within the Sacramento River and Yolo Bypass during the January 1997 flood event at this location was approximately 1 million cfs (California DWR, 2010), which is approximately equivalent to that which was predicted using the ARkFuture scenario. However, the ARkFuture scenario results in two unregulated peaks in excess of 1 million cfs with a separation of approximately 8 days. The computed unregulated runoff volume of approximately 30 million ac-ft achieved within this simulation is approximately 70% larger than the average natural runoff volume from the entire Sacramento River watershed of approximately 18 million ac-ft (USBR, 2016).
San Joaquin River
Similar to the Sacramento River results, the application of the ARkFuture scenario resulted in portentous amounts of runoff being generated. Unregulated discharge hydrographs at various locations of interest are shown below.
All regulating structures, bypass channels, levees and other man-made structures were removed from the San Joaquin River HEC-HMS model in an effort to simplify this analysis.
Friant Dam Location Results
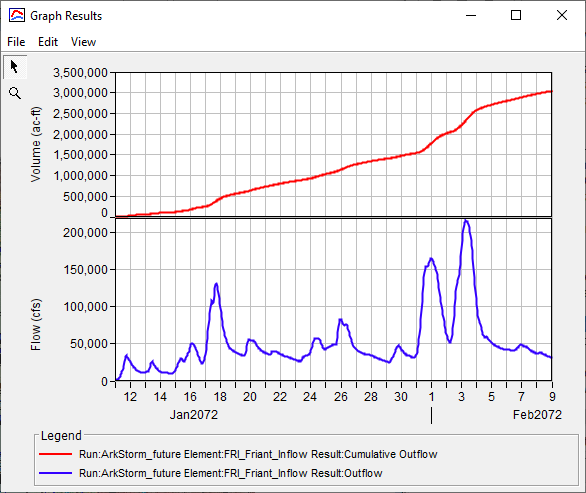
The computed unregulated inflow to Friant Dam is shown in Figure 9. For reference, the estimated peak unregulated inflow during the January 1997 flood event at this location was approximately 155,000 cfs (DWR, 2012), which is approximately 45% less than that which was predicted using the ARkFuture scenario. The computed unregulated runoff volume of approximately 3 million ac-ft achieved within this simulation is approximately 475% larger than the gross storage volume of approximately 520,500 ac-ft at Friant Dam. Significant reservoir releases would likely accompany such a large inflow event thereby increasing the effectiveness of the available storage afforded by Friant Dam.
Don Pedro Dam Location Results
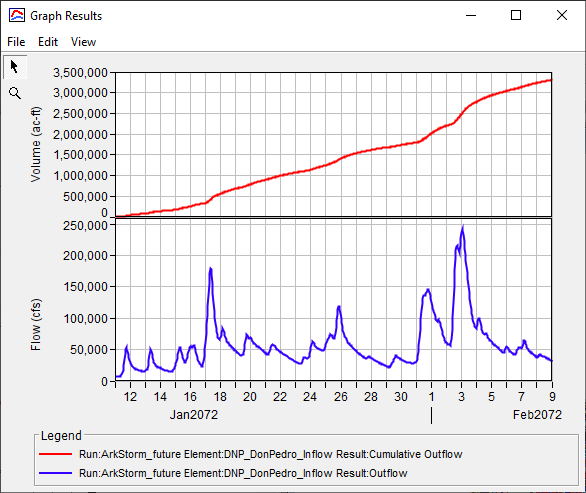
The computed unregulated inflow to Don Pedro Dam is shown in Figure 10. For reference, the estimated peak unregulated inflow during the January 1997 flood event at this location was approximately 148,000 cfs (DWR, 2012), which is approximately 70% less than that which was predicted using the ARkFuture scenario. The computed unregulated runoff volume of approximately 3.25 million ac-ft achieved within this simulation is approximately 60% larger than the gross storage volume of approximately 2.03 million ac-ft at Don Pedro Dam. Significant reservoir releases would likely accompany such a large inflow event thereby increasing the effectiveness of the available storage afforded by Don Pedro Dam.
New Melones Dam Location Results
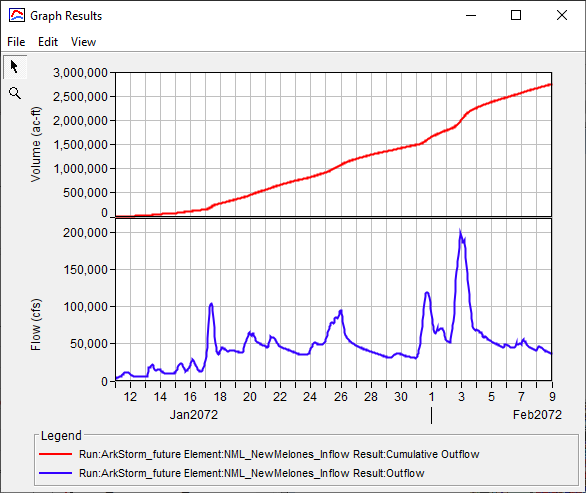
The computed unregulated inflow to New Melones Dam is shown in Figure 11. For reference, the estimated peak unregulated inflow during the January 1997 flood event at this location was approximately 92,000 cfs (DWR, 2012), which is approximately 120% less than that which was predicted using the ARkFuture scenario. The computed unregulated runoff volume of approximately 2.75 million ac-ft achieved within this simulation is approximately 15% larger than the gross storage volume of approximately 2.42 million ac-ft at New Melones Dam. Significant reservoir releases would likely accompany such a large inflow event thereby increasing the effectiveness of the available storage afforded by New Melones Dam.
Truckee River
Similar to the Sacramento River and San Joaquin River, substantial amounts of precipitation are conceptualized to fall within the Truckee River watershed during the ARkFuture scenario. However, unlike the Sacramento River and San Joaquin River simulations, air temperatures within the Truckee River watershed are relatively lower and a large portion of the precipitation applied within this hypothetical event is converted to SWE. As a result, less runoff (relative to the contributing drainage area) is generated within the Truckee River watershed than within the Sacramento River and San Joaquin River simulations. Nonetheless, runoff rates are still large and are comparable to those experienced during the January 1997 flood. Videos of cumulative precipitation and SWE within the Truckee River watershed are shown below.
Regulated discharge hydrographs at various locations of interest are shown below.
Unlike the Sacramento River and San Joaquin River HEC-HMS models, major reservoirs ARE included within the Truckee River HEC-HMS model. Release decisions at each project were estimated using past large flood events (e.g., January 1997) and pertinent operating criteria like water control manuals.
Truckee River at Truckee, CA Location Results
The computed flow at the Truckee River at Truckee, CA USGS stream gage is shown in Figure 12. For reference, the peak flow during the January 1997 flood event at this location was approximately 11,900 cfs, which is approximately equivalent to that which was predicted using the ARkFuture scenario.
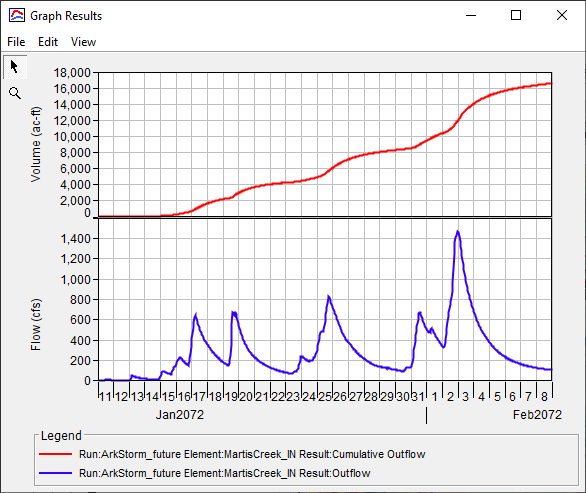
Martis Creek Dam Results
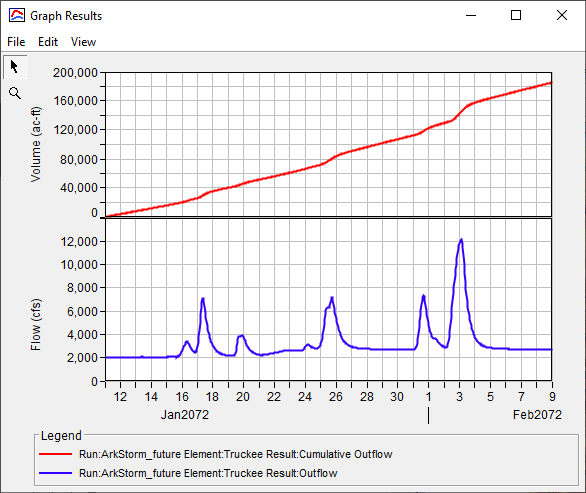
The computed inflow to Martis Creek Dam is shown in Figure 13. For reference, the estimated peak inflow during the January 1997 flood event at this location was approximately 2,125 cfs, which is approximately 34% greater than that which was predicted using the ARkFuture scenario. The computed runoff volume of approximately 16,000 ac-ft achieved within this simulation is approximately 60% less than the total storage volume of approximately 42,000 ac-ft at Martis Creek Dam.
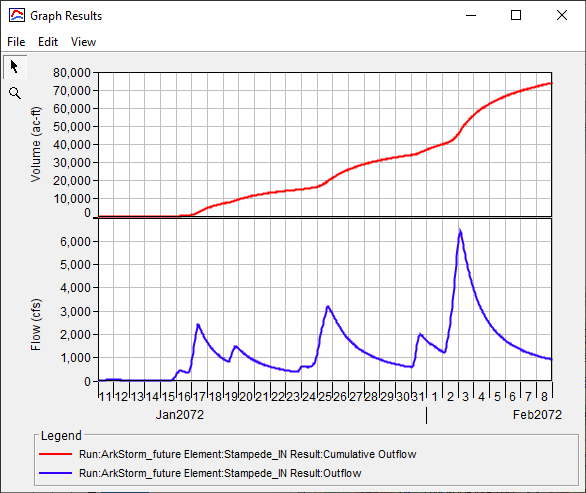
Stampede Dam Results
The computed inflow to Stampede Dam is shown in Figure 14. For reference, the estimated peak inflow during the January 1997 flood event at this location was approximately 7500 cfs, which is approximately 20% greater than that which was predicted using the ARkFuture scenario. The computed runoff volume of approximately 75,000 ac-ft achieved within this simulation is approximately 75% less than the total storage volume of approximately 300,000 ac-ft at Stampede Dam.
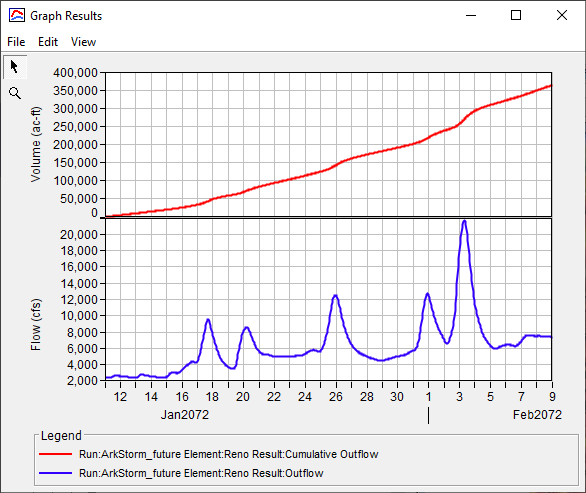
Truckee River at Reno, NV Location Results
The computed flow at the Truckee River at Reno, NV USGS stream gage is shown in Figure 15. For reference, the peak flow during the January 1997 flood event at this location was approximately 18,200 cfs, which is approximately 20% less than that which was predicted using the ARkFuture scenario.
Truckee River at Reno and Sparks, NV Location Results
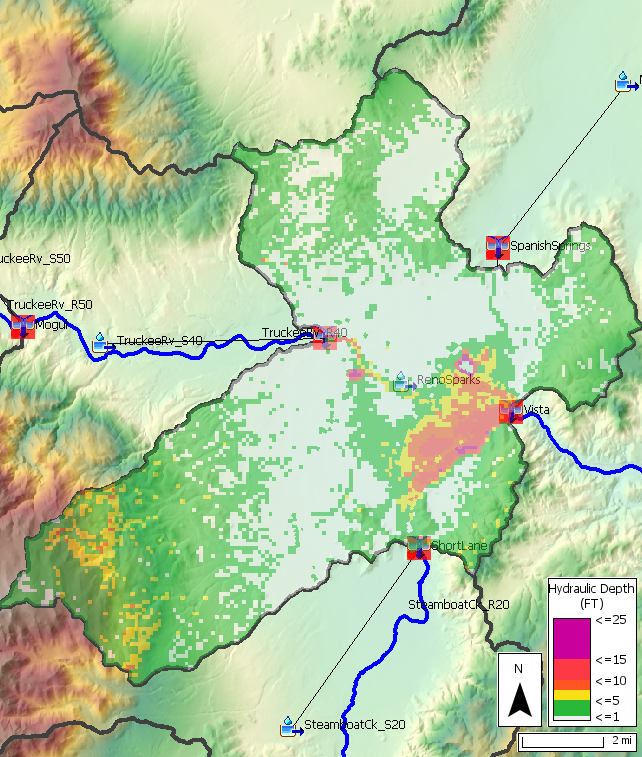
The Truckee River upstream of the USGS gage at Reno, NV flows through extremely steep (stream slopes > 50 ft/mi), incised channels. As such, hydrologic routing methods were deemed adequate to estimate translation and attenuation of flood waves through these areas. However, in the vicinity of Reno and Sparks, NV, channel slopes reduce to nearly 1 ft/mi and a floodplain several miles wide forms. Additionally, the Truckee River receives two tributaries: 1) Steamboat Creek from the south and 2) North Truckee Ditch from the north. Downstream of the USGS gage at Vista, NV, the floodplain contracts and the Truckee River enters another steep canyon.
In order to more accurately simulate the movement of water within the Reno and Sparks, NV area, the 2D Diffusion Wave transform method was used. The use of this transform method allows for additional outputs like hydraulic depth, average cell velocity, and water surface elevation.
Hydraulic depths in excess of 2 ft are predicted to occur over a wide swath of the Reno and Sparks, NV area. In fact, hydraulic depths exceeding 10 ft are prevalent in some portions of Sparks, NV in between I-80 and the Truckee River. Significant inundation is predicted to occur over the Reno-Tahoe International Airport. Inundation extents are similar to that which were achieved during the January 1997 flood event. However, inundation of these areas is expected to last significantly longer than what was experienced in the January 1997 flood event due to the approximate month-long duration of the ARkFuture scenario. For instance, within the previously mentioned areas of Sparks, NV in between I-80 and the Truckee River, hydraulic depths greater than 1 foot are expected to be present for 3+ weeks. Videos of hydraulic depth and average cell velocity within the Reno and Sparks, NV area are shown below. The maximum hydraulic depth achieved during this simulation (regardless of time) within the Reno and Sparks, NV area is shown in Figure 16.
Summary
In this tutorial, ARkStorm 2.0 meteorology (precipitation and air temperature) was applied to three separate HEC-HMS projects to demonstrate its usage. These meteorologic boundary conditions can be efficiently downloaded, imported, and applied to HEC-HMS projects throughout the state of California and surrounding areas.
The ARkStorm meteorologic data can be downloaded using the link presented above.
Existing projects encompassing the Sacramento River, San Joaquin River, and Truckee Rivers were used to demonstrate the usage of this data. The amount of precipitation contained within the ARkFuture scenario is staggering. When combined with elevated air temperatures and assumed January 1997 antecedent conditions, the amount of runoff that is generated is truly extraordinary. For example, over 6 million ac-ft of runoff is estimated to be produced within the contributing drainage area upstream of Shasta Dam. Also, two distinct unregulated peak discharges of 1 million cfs each are estimated to occur at the confluence of the Sacramento and American Rivers. Inundation depths and extents within the Reno and Sparks, NV area are also expected to be severe.
In general, unregulated peak discharges are similar to that which were estimated to have occurred during the January 1997 flood event had reservoirs, levees, and other flood control structures not been constructed. However, this is not uniformly the case throughout all areas that were simulated. Since the January 1997 flood event, USACE and other Federal, State, and local agencies have refined flood risk management infrastructure, reservoir operation, and emergency management practices throughout the state of California. These completed or ongoing projects include the Folsom Dam Auxiliary Spillway, Folsom Dam Raise, Marysville Ring Levee, Natomas Levee Improvements, Sacramento Levee Upgrades, and West Sacramento Levee Improvement Project, amongst others. A common goal amongst all of these projects is to reduce flood risks to affected communities. Future studies by Federal, State, and local agencies are planned to better quantify the hydrologic, hydraulic, and economic consequences that would be likely to occur during this hypothetical event.