Download PDF
Download page Soil Moisture Accounting Loss Model.
Soil Moisture Accounting Loss Model
Basic Concepts and Equations
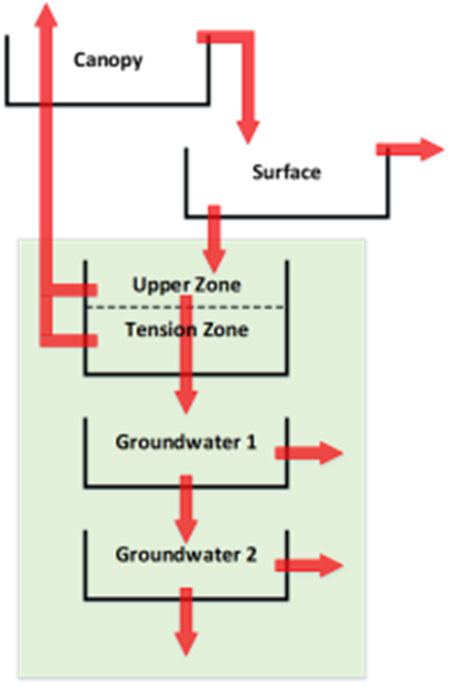
The soil moisture accounting (SMA) method simulates the movement and storage of water through the soil profile as well as multiple groundwater layers (Leavesley, Lichty, Troutman, & Saindon, 1983). The implementation of this method within HEC-HMS is described in detail within Bennett (1998). Using the soil moisture accounting method allows for continuous simulation when combined with a canopy method that will extract water from the soil in response to potential ET computed in the meteorologic model. When both a canopy and surface method are used in combination with the soil moisture accounting loss method, the system can be conceptualized as shown in the following figure.

Storage Component
The SMA model represents the watershed with a series of storage layers, as illustrated above. Rates of inflow to, outflow from, and capacities of the layers control the volume of water lost or added to each of these storage components. Current storage contents are calculated during the simulation and vary continuously both during and between storms. The different storage layers in the SMA model are:
- Canopy-interception storage. Canopy interception represents precipitation that is captured on trees, shrubs, and grasses, and does not reach the soil surface. Precipitation is the only inflow into this layer. When precipitation occurs, it first fills canopy storage. Only after this storage is filled does precipitation become available for filling other storage volumes. Water in canopy interception storage is held until it is removed by evaporation.
- Surface-interception storage. Surface depression storage is the volume of water held in shallow surface depressions. Inflows to this storage come from precipitation not captured by canopy interception and in excess of the infiltration rate. Outflows from this storage can be due to infiltration and to ET. Any contents in surface depression storage at the beginning of the time step are available for infiltration. If the water available for infiltration exceeds the infiltration rate, surface interception storage is filled. Once the volume of surface interception is exceeded, this excess water contributes to surface runoff.
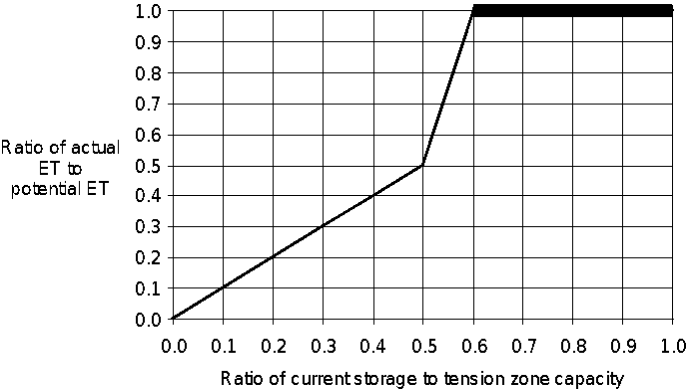
- Soil-profile storage. The soil profile storage represents water stored in the top layer of the soil. Inflow is infiltration from the surface. Outflows include percolation to a groundwater layer and ET. The soil profile zone is divided into two regions, the upper zone and the tension zone. The upper zone is defined as the portion of the soil profile that will lose water to ET and/or percolation. The tension zone is defined as the area that will lose water to ET only. The upper zone represents water held in the pores of the soil. The tension zone represents water attached to soil particles. ET occurs from the upper zone first and tension zone last. Furthermore, ET is reduced below the potential rate occurring from the tension zone, as shown in the figure below. This represents the natural increasing resistance in removing water attached to soil particles. ET can also be limited to the volume available in the upper zone during specified winter months, depicting the end of transpiration by annual plants.

- Groundwater storage. Groundwater layers in the SMA represent horizontal interflow processes. The SMA model can include either one or two such layers. Water percolates into groundwater storage from the soil profile. The percolation rate is a function of a user-specified maximum percolation rate and the current storage in the layers between which the water flows. Losses from a groundwater storage layer are due to groundwater flow or to percolation from one layer to another. Percolation from the soil profile enters the first layer. Stored water can then percolate from layer 1 to groundwater layer 2 or from groundwater layer 2 to deep percolation. In the latter case, this water is considered lost from the system; aquifer flow is not modeled in the SMA.
Flow Component
The SMA model computes flow into, out of, and between the storage volumes. This flow can take the form of:
- Precipitation, which is an input to the system of storages. Precipitation first contributes to the canopy interception storage. If the canopy storage fills, the excess amount is then available for infiltration.
- Infiltration, which refers to the water that enters the soil profile from the ground surface. Water available for infiltration during a time step comes from precipitation that passes through canopy interception, plus water already in surface storage.
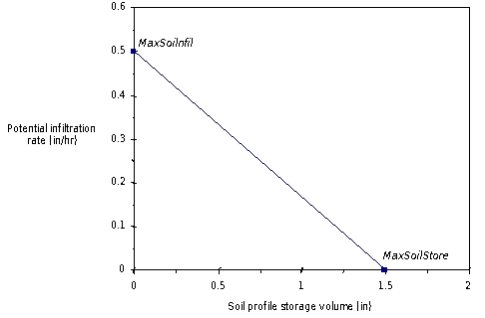
The volume of infiltration during a time interval is a function of the volume of water available for infiltration, the state (fraction of capacity) of the soil profile, and the maximum infiltration rate specified by the model user. For each interval in the analysis, the SMA model computes the potential infiltration volume, PotSoilInfl, as:
| 1) | PotSoiInfil = MaxSoilInfil-\frac{CurSoilStore}{MaxSoilStore}MaxSoilInfil |
where MaxSoilInfl = the maximum infiltration rate; CurSoilStore = the volume in the soil storage at the beginning of the time step; and MaxSoilStore = the maximum volume of the soil storage. The actual infiltration rate, ActInfil, is the minimum of PotSoilInfil and the volume of water available for infiltration. If the water available for infiltration exceeds this calculated infiltration rate, the excess then contributes to surface interception storage.
The above figure illustrates the relationship of these, using an example with MaxSoilInfil = 0.5 in/hr and MaxSoilStore = 1.5 in. As illustrated, when the soil profile storage is empty, potential infiltration equals the maximum infiltration rate, and when the soil profile is full, potential infiltration is zero.
- Percolation, which refers to the movement of water downward from the soil profile, through the groundwater layers, and into a deep aquifer.
In the SMA model, the rate of percolation between the soil-profile storage and a groundwater layer or between two groundwater layers depends on the volume in the source and receiving layers. The rate is greatest when the source layer is nearly full and the receiving layer is nearly empty. Conversely, when the receiving layer is nearly full and the source layer is nearly empty, the percolation rate is less. In the SMA model, the percolation rate from the soil profile into groundwater layer 1 is computed as:
| 2) | PotSoilPerc=MaxSoilPerc(\frac{CurSoilStore}{MaxSoilStore})(1-\frac{CurGWStore}{MaxGWStore}) |
where PotSoilPerc = the potential soil percolation rate; MaxSoilPerc = a user-specified maximum percolation rate; CurSoilStore = the calculated soil storage at the beginning of the time step; MaxSoilStore = a user-specified maximum storage for the soil profile; CurGwStore = the calculated groundwater storage for the upper groundwater layer at the beginning of the time step; and MaxGwStore = a user-specified maximum groundwater storage for groundwater layer 1.
The potential percolation rate computed with Equation 22 is multiplied by the time step to compute a potential percolation volume. The available water for percolation is equal the initial soil storage plus infiltration. The minimum of the potential volume and the available volume percolates to groundwater layer 1.
A similar equation is used to compute PotGwPerc, the potential percolation from groundwater layer 1 to layer 2:
| 3) | PotGWPerc=MaxPercGW(\frac{CurGWStore}{MaxGWStore})(1-\frac{CurGWStore}{MaxGWStore}) |
where MaxPercGw = a user-specified maximum percolation rate; CurGwStore = the calculated groundwater storage for the groundwater layer 2; and MaxGwStore = a user-specified maximum groundwater storage for layer 2. The actual volume of percolation is computed as described above.
For percolation directly from the soil profile to the deep aquifer in the absence of groundwater layers, for percolation from layer 1 when layer 2 is not used, or percolation from layer 2, the rate depends only on the storage volume in the source layer. In those cases, percolation rates are computed as
| 4) | PotSoilPerc=MaxSoilPerc\frac{CurSoilStore}{MaxSoilStore} |
and
| 5) | PotGWPerc=MaxPercGW\frac{CurGWStore}{MaxGWStore} |
respectively, and actual percolation volumes are computed as described above.
- Surface runoff, which is the water that exceeds the infiltration rate and overflows the surface storage. This volume of water is direct runoff.
- Groundwater flow, which is the sum of the volumes of groundwater flow from each groundwater layer at the end of the time interval. The rate of flow is computed as:
| 6) | GWFlow_{t+1}=\frac{ActSoilPerc+CurGW_{i}Store-PotGW_{i}Perc-\frac{1}{2}GWFlow_{t}*TimeStep}{RoutGW_{i}Store+\frac{1}{2}TimeStep} |
where GwFlowt and GwFlowt+1 = groundwater flow rate at beginning of the time interval t and t+1, respectively; ActSoilPerc = actual percolation from the soil profile to the groundwater layer; PotGwiPerc = potential percolation from groundwater layer i; RoutGwiStore = groundwater flow routing coefficient from groundwater storage i; TimeStep = the simulation time step; and other terms are as defined previously. The volume of groundwater flow that the watershed releases, GwVolume, is the integral of the rate over the model time interval. This is computed as
| 7) | GWVolume=\frac{1}{2}(GWFlow_{t+1}+GWFlow_{t})*TimeStep |
This volume may be treated as inflow to a linear reservoir model to simulate baseflow, as described in the Linear Reservoir Model section.
- Evapotranspiration (ET), which is the loss of water from the canopy interception, surface depression, and soil profile storages. In the SMA model, potential ET demand currently is computed from monthly pan evaporation depths, multiplied by monthly-varying pan correction coefficients, and scaled to the time interval.
The potential ET volume is satisfied first from canopy interception, then from surface interception, and finally from the soil profile. Within the soil profile, potential ET is first fulfilled from the upper zone, then the tension zone. If potential ET is not completely satisfied from one storage in a time interval, the unsatisfied potential ET volume is filled from the next available storage.
When ET is from interception storage, surface storage, or the upper zone of the soil profile, actual ET is equivalent to potential ET. When potential ET is drawn from the tension zone, the actual ET is a percentage of the potential, computed as:
| 8) | ActEvapSoil=PotEvapSoil*f(CurSoilStore,MaxTenStore) |
where ActEvapSoil = the calculated ET from soil storage; PotEvapSoil = the calculated maximum potential ET; and MaxTenStore = the user specified maximum storage in the tension zone of soil storage. The function, f(·), in Equation 8 is defined as follows:
- As long as the current storage in the soil profile exceeds the maximum tension zone storage (CurSoilStore/MaxTenStore > 1), water is removed from the upper zone at a onetoone rate, the same as losses from canopy and surface interception.
- Once the volume of water in the soil profile zone reaches the tension zone, f(·) is determined similar to percolation. This represents the decreasing rate of ET loss from the soil profile as the amount of water in storage (and therefore the capillary force) decreases.
Order of Model Computations
Flow into and out of storage layers is computed for each time step in the SMA model. The order of computations in each time step depends upon occurrence of precipitation or ET, as follows:
- If precipitation occurs during the interval, ET is not modeled. Precipitation contributes first to canopy-interception storage. Precipitation in excess of canopy-interception storage, combined with water already in surface storage, is available for infiltration. If the volume available is greater than the available soil storage, or if the calculated potential infiltration rate is not sufficient to deplete this volume in the determined time step, the excess goes to surface-depression storage. When surface-depression storage is full, any excess is surface runoff.
Infiltrated water enters soil storage, with the tension zone filling first. Water in the soil profile, but not in the tension zone, percolates to the first groundwater layer. Groundwater flow is routed from the groundwater layer 1, and then any remaining water may percolate to the groundwater layer 2. Percolation from layer 2 is to a deep aquifer and is lost to the model.
- If no precipitation occurs, ET is modeled. Potential ET is satisfied first from canopy storage, then from surface storage. Finally, if the potential ET is still not satisfied from surface sources, water is removed from the upper-soil profile storage. The model then continues as described above for the precipitation periods.
Required Parameters
Parameters that are required to utilize this method within HEC-HMS include the amounts of storage within the soil, groundwater 1, and groundwater 2 layers that are initially filled [percent], the maximum infiltration rate [in/hr or mm/hr], directly connected impervious area [percent], the maximum soil storage [in or mm], tension storage [in or mm], the maximum soil percolation rate [in/hr or mm/hr], the maximum groundwater layer 1 storage [in], the maximum groundwater layer 1 percolation rate [in/hr or mm/hr], the groundwater layer 1 coefficient [hr], the maximum groundwater layer 2 storage [in], the maximum groundwater layer 2 percolation rate [in/hr or mm/hr], and the groundwater 2 layer coefficient [hr].
The amount of initial storage refers to the initial saturation of each layer at the beginning of a simulation and should be determined through model calibration. The maximum infiltration rate sets the upper bound on infiltration from the surface storage into the soil. This is the upper bound on infiltration; the actual infiltration in a particular time interval is a linear function of the surface and soil storage, if a surface method is selected. Without a selected surface method, water will always infiltrate at the maximum rate. Soil storage represents the total storage available in the soil layer. Tension storage specifies the amount of water storage in the soil that does not drain under the effects of gravity. Percolation from the soil layer to the upper groundwater layer will occur whenever the current soil storage exceeds the tension storage. Water in tension storage is only removed by ET. By definition, tension storage must be less than soil storage. The soil percolation sets the upper bound on percolation from the soil storage into the upper groundwater layer. The actual percolation rate is a linear function of the current storage in the soil and the current storage in the upper groundwater layer. The maximum groundwater layer 1 storage represents the total storage in the upper groundwater layer. The groundwater layer 1 percolation rate sets the upper bound on percolation from the upper groundwater into the lower groundwater layer. The groundwater layer 2 layer percolation rate sets the upper bound on deep percolation out of the system. The aforementioned parameters are typically estimated using the predominant soil texture and literature values. The groundwater layer 1 and groundwater layer 2 coefficients are used as the time lag on a linear reservoir for transforming water in storage to lateral outflow.
A Note on Parameter Estimation
The values presented here are meant as initial estimates. This is the same for all sources of similar data including Engineer Manual 1110-2-1417 Flood-Runoff Analysis and the Introduction to Loss Rate Tutorials. Regardless of the source, these initial estimates must be calibrated and validated.