Download PDF
Download page Clark Unit Hydrograph Model.
Clark Unit Hydrograph Model
The Clark unit hydrograph method utilizes the concept of an instantaneous unit hydrograph to route excess precipitation to the subbasin outlet. An instantaneous unit hydrograph is derived by instantaneously applying a unit depth (e.g. one inch) of excess precipitation over a watershed (Clark, 1945). The resultant unit hydrograph is entirely theoretical (i.e. real precipitation cannot be applied instantaneously to a watershed) but it has the distinct advantage of characterizing the watershed’s response to rainfall without reference to the duration of excess precipitation (Chow, Maidment, & Mays, 1988). This method explicitly represents two critical processes in the transformation of excess precipitation to runoff: 1) the translation (or movement) of excess precipitation from its origin throughout the watershed to the outlet and 2) the attenuation (or reduction) of the magnitude of the discharge as the excess precipitation is temporarily stored throughout the watershed (Hydrologic Engineering Center, 2000). Conceptually, water is translated from remote points to the watershed outlet with delay but without attenuation. Attenuation is then incorporated, conceptually speaking, at the watershed outlet. Three parameters are utilized within this method:
- Time of concentration (Tc), which is equivalent to the time it takes for excess precipitation to travel from the hydraulically-most remote point of the watershed to the outlet,
- Watershed storage coefficient (R), which is equivalent to attenuation due to storage effects throughout the watershed (Kull & Feldman, 1998), and
- Time-Area histogram, which represents the watershed area that contributes to flow at the outlet as a function of time.
Basic Concepts and Equations
The time-area histogram is used in conjunction with Tc to first transform excess precipitation into runoff. While a user-specified time-area histogram can be used, a smooth function fitted to a typical time-area relationship can oftentimes adequately represent the temporal distribution of flow (i.e. translation) for most watersheds and is provided as a default :
| 1) | \frac{A_t}{A}=\left\{\begin{array} 1.414\left(\frac{t}{T_c}\right)^{1.5} \quad \text { for } t \leq \frac{T_c}{2} \\ 1-1.414\left(1-\frac{t}{T_c}\right)^{1.5} \quad \text { for } t \geq \frac{T_c}{2} \end{array}\right. |
where At = cumulative watershed area contributing at time t and A = total watershed area. This typical time-area relationship was derived from an elliptically-shaped watershed. Through the use of this simplified time-area histogram, only Tc and R are required to completely define the instantaneous unit hydrograph for a watershed. As described within Modified Clark Unit Hydrograph, through the use of GIS and the Modified Clark method, watershed-specific time-area histograms can be efficiently created and used.
After translation, attenuation is incorporated using a linear reservoir model which begins with the continuity equation :
| 2) | \frac{d S}{d t}=I_t-O_t |
where dS/dt = time rate of change of water in storage at time t; It = average inflow to storage at time t; and Ot = outflow from storage at time t. With the linear reservoir model, storage at time t can be related to outflow :
| 3) | S_t=R O_t |
where R = a constant linear reservoir parameter. Combining and solving Equation 2 and Equation 3 using a finite difference approximation yields :
| 4) | O_t=C_A I_t+C_B O_{t-1} |
where CA and CB = routing coefficients. The coefficients are then calculated according to :
| 5) | \begin{array}{c} C_A=\frac{\Delta t}{R+0.5 \Delta t} \\ C_B=1-C_A \end{array} |
Finally, the average outflow during period t is then calculated as :
| 6) | \bar{O}_t=\frac{O_{t-1}+O_t}{2} |
where Ot-1 = outflow from the previous time step. Solving Equation 4 and Equation 6 recursively yields values of \bar{O}_t. However, if the inflow ordinates in Equation 4 are runoff from a unit of excess, the values of \bar{O}_t are, in fact, a unit hydrograph. As the solution is recursive, outflow will theoretically continue for an infinite duration. Within HEC-HMS, computation of the unit hydrograph ordinates continues until the volume of the outflow exceeds 0.995 inches or mm. The unit hydrograph ordinates are then adjusted using a depth-weighted consideration to produce a unit hydrograph with a volume exactly equal to one unit of depth.
Variable Parameter Method
According to Sherman (1932), the unit hydrograph of a watershed is “…the basin outflow resulting from one unit of direct runoff generated uniformly over the drainage area at a uniform rainfall rate during a specified period of rainfall duration.” This implies that ordinates of any hydrograph resulting from a quantity of runoff-producing rainfall of a defined duration would be equal to corresponding ordinates of a unit hydrograph for the same areal distribution of rainfall, multiplied by the ratio of excess precipitation values (U.S. Army Corps of Engineers, 1959). However, due to differences in areal distributions of rainfall and hydraulic reactions between large and small precipitation events, the corresponding unit hydrographs have not been found to be equal, as implied by unit hydrograph theory (Minshall, 1960), (U.S. Army Corps of Engineers, 1991), (Harrison, 1999), (England, Klawon, Klinger, & Bauer, 2006). Typically, as excess precipitation rates increase, translation of a flood wave becomes more rapid while attenuation decreases resulting in a more peaked unit response at the location of interest (Rodriguez-Iturbe & Valdes, 1979), (Meyersohn, 2016).
The “Variable Parameter” method can be used to avoid the aforementioned limitations by allowing both Tc and R to change as excess precipitation rates increase or decrease. Anticipated increases and decreases in translation time and/or attenuation can be simulated with excess precipitation-dependent Tc and R relationships. When used during extreme event simulations, this allows the unit response to vary. The runoff response achieved with the Variable Clark method has been shown to achieve results that are similar to those of much more complex two-dimensional routing methods in a fraction of the computational time (Bartles, 2016).
Additional discussion regarding this method, including means by which Variable Clark parameters can be estimated for ungaged locations in California, can be found here: Bartles and Meyersohn (2023). A tutorial demonstrating the usage of Variable Tc and R relationships can be found here: Applying the Variable Clark Unit Hydrograph Method.
Maricopa County, AZ Method
The “Maricopa County” method makes use of the following equations to estimate Tc and R :
| 7) | T_c=11.4 * L^{0.5} * K_b{ }^{0.52} * S^{-0.31} * i^{-0.38} \\ |
| 8) | R=0.37 T_c{ }^{1.11} * A^{-0.57} * L^{0.8} |
where L is the length of the hydraulically longest flow path [mi or km], S is the watercourse slope of the longest flow path [ft/mi or m/km], Kb is the resistance coefficient, and i is the average excess precipitation intensity [in/hr or mm/hr]. This approach should only be utilized for simulations within Maricopa County, AZ.
Required Parameters
Parameters that are required to utilize the “Standard” Clark method within HEC-HMS include Tc [hours], R [hours], and an optional time-area curve. Tc and R are commonly estimated using watershed characteristics and regression equations. If the “Variable Parameter” method is chosen, an index excess precipitation [inches], excess precipitation vs. Tc relationship, and excess precipitation vs. R relationship is required. The index excess precipitation is used to relate the specified Tc and R values against the variable parameter relationships. Typically, this value is set equal to 1 inch/hour (or 1 mm/hr). The excess precipitation vs. Tc relationships are commonly derived from two-dimensional simulations. If the “Maricopa County” method is chosen L, Kb, and S must be specified by the user. After running a preliminary simulation, the top ten highest five-minute time interval excess precipitation values will be extracted and used to compute Tc and R.
A tutorial describing an example application of this transform method, including parameter estimation and calibration, can be found here: Estimating Clark Unit Hydrograph Parameters.
Estimating Parameters
The Clark method employs several parameters including Tc, R, and a time-area histogram. Some of these parameters have physical meaning while others do not. Due to that fact, differing methods have been used in practice to initially estimate these parameters. Also, modifications to these parameters have been found to be warranted for use within extreme event simulations to account for non-linear routing phenomena that have been observed. Initial parameter estimates are typically made using GIS and various terrain, land use, hydrography, and watershed boundary layers.
The most commonly used terrain data is distributed by the USGS as the National Elevation Dataset (NED). The NED includes multiple layers at varying horizontal resolutions. Typically, a horizontal resolution of 1/3rd arc second (approximately 10 meters) is appropriate for use within hydrologic applications that encompass 100 to 1,000 square miles. However, the most appropriate horizontal resolution for each application is specific to the study and/or watershed physical characteristics.
The most commonly used hydrography and watershed boundary data is also distributed by the USGS as the National Hydrograph Dataset (NHD) and the Watershed Boundary Dataset (WBD). The NHD and WBD also include multiple versions at varying resolutions. The NED, NHD, and WBD can be accessed through the USGS National Map: “https://viewer.nationalmap.gov/basic/”.
Time of Concentration
Tc can be estimated for a watershed in multiple ways. The most commonly used methods include:
- Computing a flow length and assuming a constant velocity,
- Computing a flow length and discretizing changes in velocity, and
- Using regional regression equations which were developed from observed data in a similar region.
Travel time, Tt, refers to the amount of time necessary for runoff to move from one location to another within a watershed and can be computed using the following:
| 9) | T_t = \frac{L}{3600*V} |
where Tt = travel time [hours], L = flow length [feet], 3600 = conversion factor from seconds to hours, and V = average velocity [feet/second]. An average velocity can be estimated using multiple approaches including simplistic nomographs (Natural Resources Conservation Service, 1999), Kinematic Wave Theory (Hydrologic Engineering Center, 1993), and/or Manning’s equation.
However, as runoff moves down gradient, predominant flow regimes tend to change due to factors like channel shape, slope, roughness, and contributing drainage area. For instance, runoff that begins as sheet flow may transition to shallow concentrated flow after a short distance. As the flow regime changes, velocity tends to change as well. When non-uniform velocities are expected to occur within a watershed, it becomes computationally convenient to discretize the predominant length over which each flow regime tends to occur, thus allowing for more accurate computations of Tc. This method is summarized within NRCS Technical Release (TR) 55 (Natural Resources Conservation Service, 1999).
Within this method, three flow regimes are typically discretized: 1) sheet flow, 2) shallow concentrated flow, and 3) open channel flow. Tc can then be computed as:
| 10) | T_c=T_{sheet}+T_{shallow}+T_{channel} |
where Tsheet = sum of travel time in sheet flow segments, Tshallow = sum of travel time in shallow flow segments (e.g. streets, gutters, shallow rills, etc), Tchannel = sum of travel time in open channel flow segments. Equation 7 assumes that Tc is derived from the longest flow path within the watershed.
Sheet flow can be conceptualized as flow that moves over planar surfaces with flow depths that are less than 0.1 feet (Natural Resources Conservation Service, 1999). An approximation of the Kinematic Wave equations can be used to estimate sheet flow travel time [hours]:
| 11) | T_{sheet}=\frac{0.007(N*L)^{0.8}}{{\sqrt(P_{2-10})}*S_f ^{0.4}} |
where N = overland flow roughness coefficient, L = flow length [feet], P2-10 = ½ annual exceedance probability 24-hour duration rainfall [inches], and Sf = friction slope [ft/ft]. The overland flow roughness coefficient is typically much larger than an equivalent Manning’s roughness coefficient for the same land use/channel material. Typical overland flow roughness coefficients for multiple land uses are presented in Technical Document 10 (Hydrologic Engineering Center, 1993) and (Natural Resources Conservation Service, 1999).
After a short distance, sheet flow transitions to shallow concentrated flow. The distance over which sheet flow occurs is commonly assumed to be less than 300 feet but can vary depending upon site-specific conditions (Natural Resources Conservation Service, 1999). Relationships presented in TR-55 can be used to estimate the average velocity for shallow concentrated flow:
| 12) | V_{\text {shallow }}=\left\{\begin{array}{cc} 16.1345 * \sqrt{S}, & \text { for unpaved surfaces } \\ 20.3282 * \sqrt{S}, & \text { for paved surfaces } \end{array}\right. |
where Vshallow = average velocity in shallow flow segments [ft/s] and S = watercourse slope [ft/ft]. Once Vshallow has been calculated, the travel time of shallow concentrated flow can be estimated. The point at which shallow concentrated flow transitions to open channel flow is typically assumed to exist where evidence of channels can be obtained from field surveys, maps, or aerial photographs. However, this transition can vary depending upon site-specific conditions.
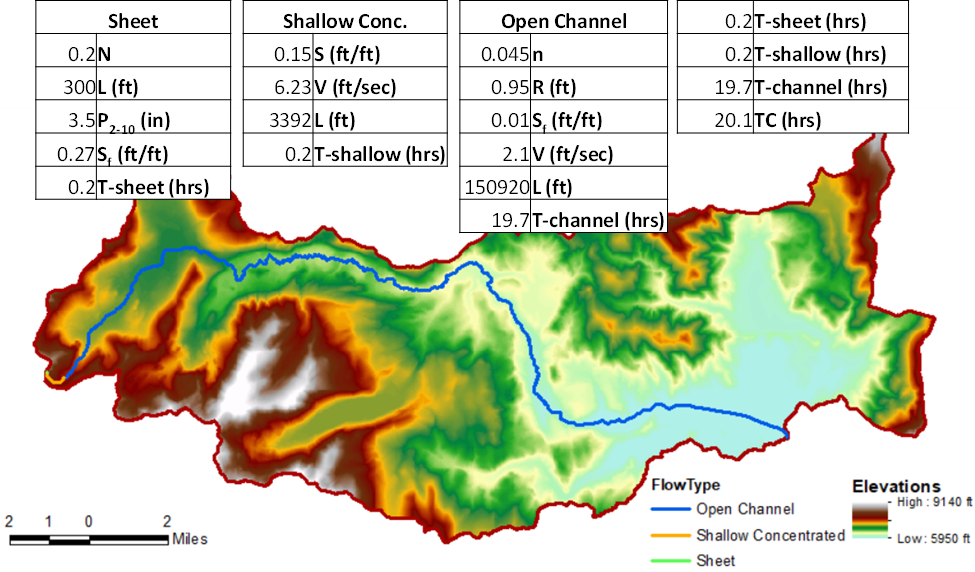
The average velocity for open channel flow can be estimated using Mannings Equation and a normal depth assumption. Manning’s roughness coefficients for common channel and overbank materials are presented in numerous sources including Chow (1959). Once Vchannel has been calculated, the travel time of channel flow can also be estimated. Finally, once all travel times have been computed, Tc can be estimated. An example application of this methodology is shown in Figure below.

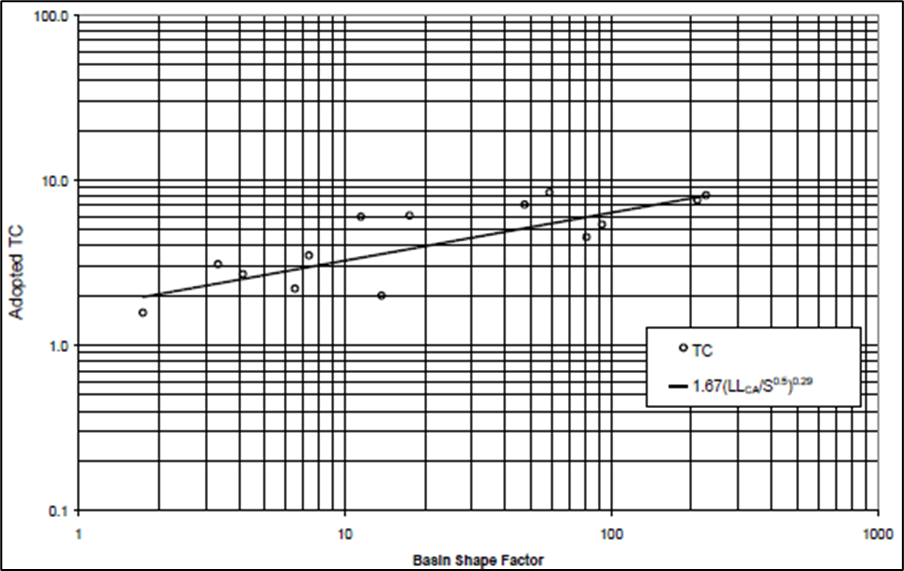
Finally, similar to the Snyder method, Tc can also be estimated through multi-linear regression analyses using various watershed physical characteristics and combinations. An example of this approach is shown within Figure below. The use of the results from regression analyses has the added advantage of allowing parameter estimation within ungaged watersheds. Typical relationships derived to estimate Tc [hours] follow the form:
| 13) | T_c=C(\frac{L*L_{ca}}{\sqrt(S_{10-85})})^X |
where C and X are parameters derived from gaged data in the same region, L = length along the stream centerline from the outlet to the watershed boundary [miles], Lca = length along the stream centerline from the outlet to a point on the stream nearest the centroid of the watershed [miles], and S10-85 = stream slope between points at 10- and 85-percent of the total distance [ft/mi].
When large standing bodies of water exist within the watershed of interest, flood waves may move downstream more rapidly than predicted within the aforementioned approach. As such, the application of the aforementioned approach may result in an over prediction of Tc. This potential over prediction can be addressed in one or more ways including: 1) refinement of initial estimates through model calibration and validation, 2) adding one or more additional flow regime transitions where flood waves are expected to travel through the standing bodies of water at a faster rate, 3) reducing the length over which open channel flow is assumed to occur, and/or 4) further discretizing the watershed (i.e. subdividing).

Reproduced from (Hydrologic Engineering Center, 2001)
Watershed Storage Coefficient
Though R has units of time, there is only a qualitative meaning for it in a physical sense. Clark indicated that R can be computed as the flow at the inflection point on the falling limb of the hydrograph divided by the time derivative of flow (Clark, 1945). This parameter is commonly estimated through multi-linear regression analyses in conjunction with Tc using the following:
| 14) | X=\frac{R}{T_c+R} |
where X = a coefficient that is determined through regional analyses. Smaller values of X result in short, steeply rising unit hydrographs and may be representative of urban watersheds. Larger values of X result in broad, slowly rising unit hydrographs and may be representative of flat, swampy watersheds. Values for X have been shown to vary due to factors like predominant channel shape, slope, and roughness; however, this coefficient has been found to be fairly constant on a regional basis (Hydrologic Engineering Center, 1988), (U.S. Army Corps of Engineers, 1994), and (Hydrologic Engineering Center, 2001). Regional regression equations for estimating watershed storage coefficients for the multiple hydrologic regions have been developed for California.
Time-Area Histogram
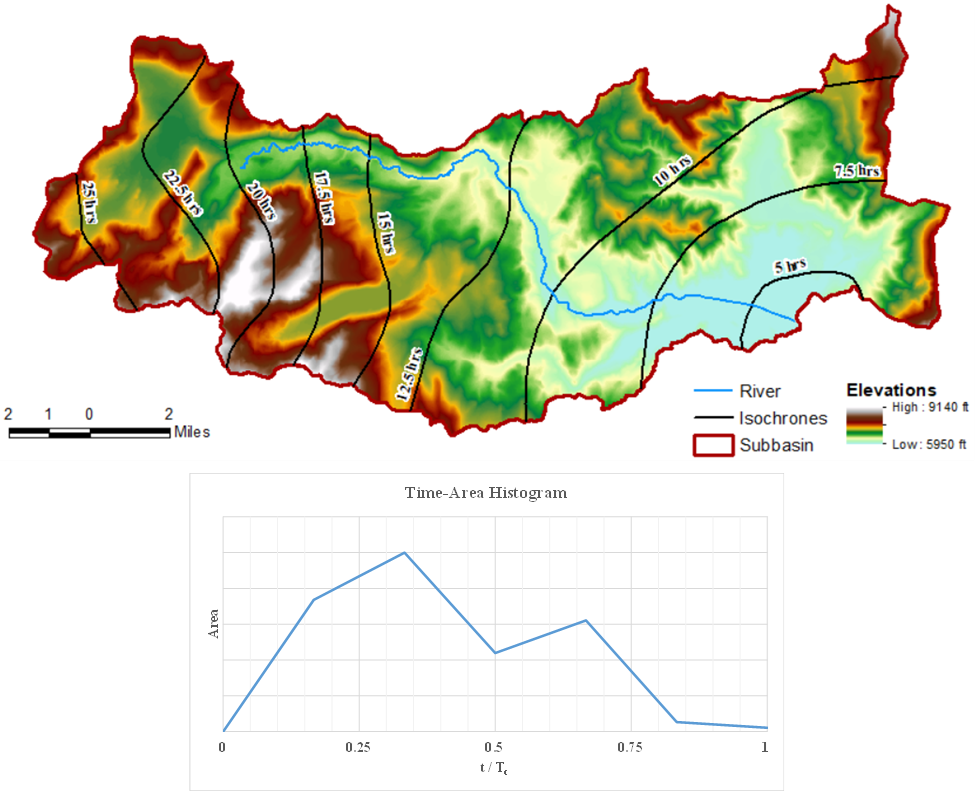
Studies at HEC have shown that a smooth function fitted to a typical time-area relationship can oftentimes adequately represent the temporal distribution of flow (i.e. translation) for most watersheds. A default time-area relationship is included within HEC-HMS and is shown in Equation 1. If a site-specific time-area histogram is required, it can be developed by demarcating lines of equal travel time, which are called “isochrones”, to divide the watershed. Then, the watershed area encompassed by each isochrone and the watershed boundary is estimated. This process is demonstrated for an example watershed within Figure below.

As previously mentioned, when large standing bodies of water exist within the watershed of interest, flood waves may move downstream more rapidly than predicted within the aforementioned approach. As such, the temporal distribution of flow may be over predicted. This potential over prediction can be addressed in one or more ways including: 1) refinement of initial parameter estimates through model calibration and validation, 2) further discretizing the watershed (i.e. subdividing), and/or 3) modifying the time-area histogram to reduce the travel time through the standing body of water.