Download PDF
Download page Customizing your View.
Customizing your View
UPDATED IN RESSIM 3.5
The OSI table and plot panel can be customized by the user using the View Menu in the OSI Menu Bar.

Set Table Colors
Upon first creation of an OSI, the Set Table Colors option may not respond. If this is the case, save and close the OSI, then reopen it.
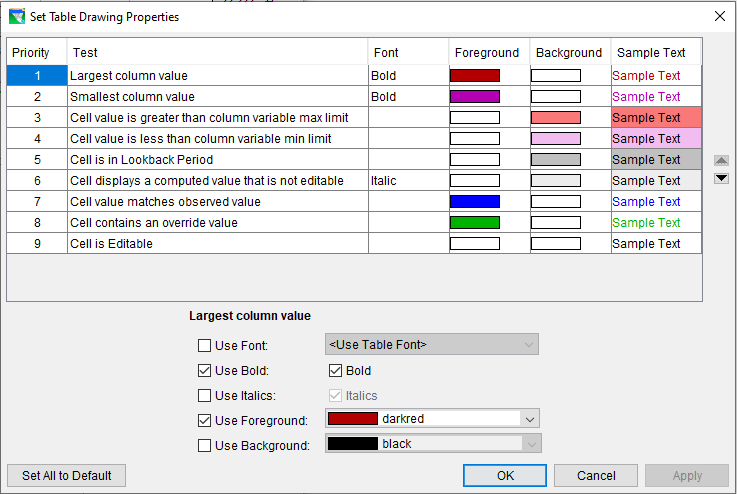
Set Table Colors allows the user to customize the view of the tables in the OSI editor. Changes made to this table are global. They will apply to all variables, across all tabs and across all alternatives and networks.
The upper portion of the window contains a non-editable table that provides the user with an overview of how the data will display in the OSI table panel.
- Priority—The way the items are ranked will determine how the font and cell will display in the OSI table panel. Items that have a higher priority will display before those with lower priorities. If an item meets the standards of 2 tests, the higher-ranking priority will display first. The order of the priorities can be adjusted by the user by selecting the test item then using the up and down arrows on the right-hand side.
- Test—Lists all available tests. This list cannot be edited to add or remove a test.
- Font—List font and font styles applied to each test. If no font is listed, the default font is being used. If the user changes the font to something other than the default, the font will be listed here.
- Foreground—Font color
- Background—Cell color
- Sample Text—Will display font, font style, and color of font and cell for preview.
The lower portion of the window allows the user to edit the font and cell properties. In order to edit a specific test, the test must be selected in the upper table. The user can adjust the fonts and font styles as well as the font and cell colors. Any changes made will be reflected in the upper table. If the user would like to undo all changes, the Set All to Default button will reset all tests to default.
Action Button Selection

The Action Button Selector window allows the user to customize the action buttons shown in the OSI. Available action buttons are shown in the left window and selected actions (those whose buttons will appear on the right side of the OSI window) are shown on the right. A key element to understanding the Action Button Selector window is that the buttons must be applied to a domain, which could be
- The overall OSI itself
- A tab in the OSI
- Computed Parameters in the model
For example, if action buttons are currently selected for the OSI as shown below,
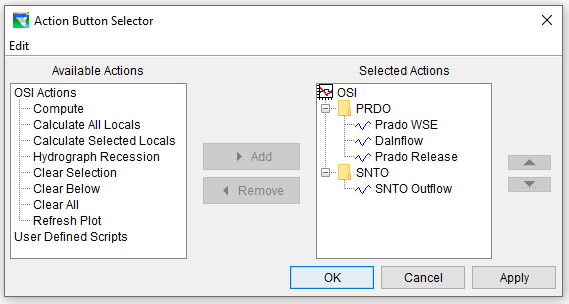
then selecting the icon labeled OSI on the right, and the OSI action button labeled Compute All Locals on the left, and then clicking the Add button in the center of the window will add the Calculate All Locals Button to the overall OSI domain as shown below.
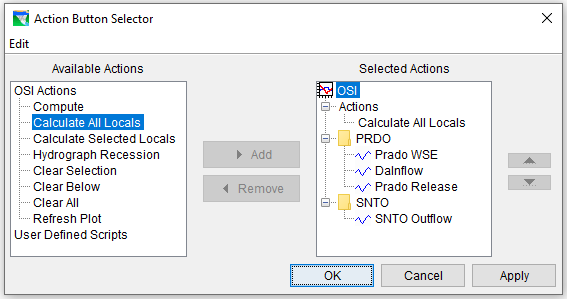
If the Add button is grayed out, then an action has not been fully specified. Check to make sure the action on the left is being added to a specific domain on the right and that an action on the left is also specified. The Remove button acts in the opposite manner, removing the action button from the domain selected on the right.
Likewise, if the PRDO folder had been selected at right when the Add button was clicked, then the result would have been applied to only the PRDO tab as shown below.
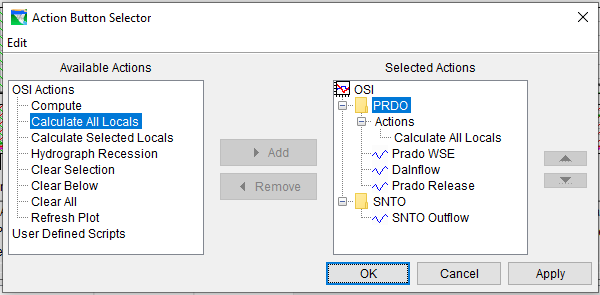
Defining buttons for a specific folder will override any and all buttons specified for the overall OSI, so the following selection
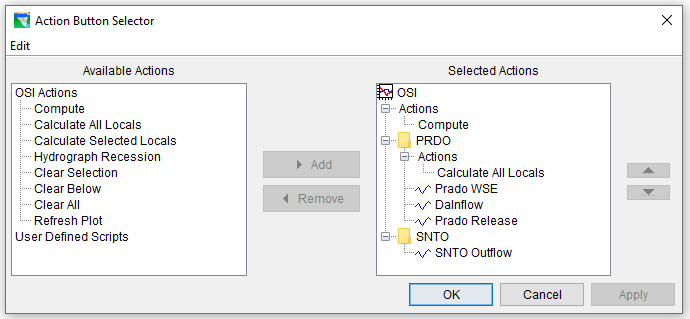
would cause the Compute All Locals button (and NOT the Compute button) to be displayed on the PRDO tab like this:
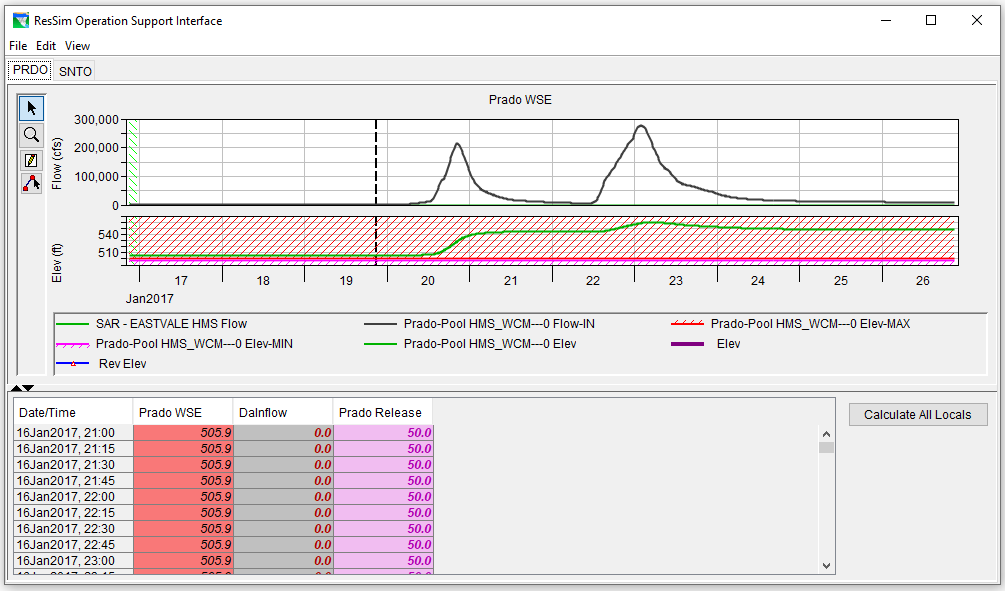
but will only display the Compute Button on other tabs.
The Edit menu button at the top of the window has only two options:
- Clear Actions - This allows the user to clear all selected actions for any domain selected. If a domain with actions is not selected, the option will be grayed out.
- Reset Default Actions - This allows the user to reset actions to the program defaults (all buttons present under OSI and none present on any tabs). Note that a domain must be selected or this option will be grayed out.
The selectable action buttons include
- Compute
- Calculate All Locals
- Calculate Selected Locals
- Hydrograph Recession
- Clear Selection
- Clear Below
- Clear All
- Refresh Plot
User-defined scripts may also be added as buttons on various tabs of the OSI. This is accomplished in the same manner as it is done with action buttons.
Graphical Editor Properties
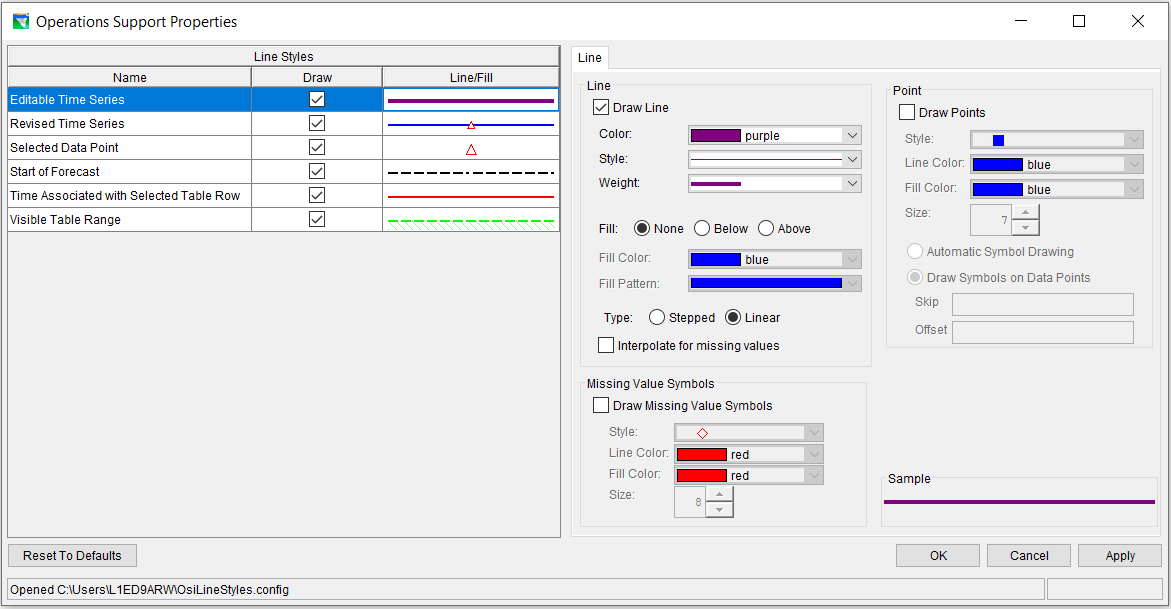
Graphical Editor Properties allows the user to customize the view of the plots in the OSI editor. Changes made to this editor are global. They will apply to all variables, across all tabs and across all alternatives and networks.
The Line Styles table displays typical data types with default line and fill styles predefined. The user can edit all of these fields and change default line and fill styles for existing types. There is no option to add or delete rows; however, the user is able to turn off a data type. The Line Styles table columns are described below in detail:
- Name—The Name represents different data types and certain aspects of your simulation window.
- Editable Time Series—Shows data that can be edited within the table or on the plot using the graphical editing tool.
- Revised Time Series—Data that has been revised will display differently than original data.
- Selected Data Point—Will draw a data point that is currently selected. Data point can be selected with the table or plot panel.
- Start of Forecast—Will draw a vertical line at the start of forecast.
- Time Associated with Selected Table Row—Will draw a vertical line on the plot panel that corresponds to the data point selected in the table panel.
- Visible Table Range—Will draw a fill on the plot panel that corresponds to the data that is visible in the table panel.
- Draw—Can check/uncheck Draw box. Unchecking the draw box will turn off that item in the OSI plot panel.
- Line/Fill—The Line/Fill property determines how curves associated with a particular Name will appear in all plots. To specify the Line/Fill, select the row in the table, and then customize the Line and Point properties by using the line properties on the right side of the editor.