Download PDF
Download page Task 1 - Coincident Frequency Analysis in HEC-SSP.
Task 1 - Coincident Frequency Analysis in HEC-SSP
Initial Workshop Files
This workshop will involve a coincident frequency analysis for interior flooding in West Virginia. The data is from actual gages, but the problem being solved is fictional.
A levee is proposed to protect Phillippi, WV from excessive stages on the Tygart River. The levee will block the Tygart River flows from reaching the city of Phillippi, but will also block the interior runoff in Phillippi from draining to the river. A pond and pump station are needed to collect and detain the interior runoff and move it through/over the levee into the Tygart River. This analysis will develop a stage-frequency relationship for a proposed pond and pump station. The more influential variable (variable A) is precipitation on the interior at the Hall, WV gage, and the less influential variable (variable B) is flow in the Tygart River.

Create a new HEC-SSP Study
- Open HEC-SSP.
- Create a new study by selecting File | New Study and save the study to a preferred location (for example, C:\PROJECTS\).
- Enter "Coincident_Frequency” as the Study Name. Leave the default selections for the Unit System and Coordinate System.
- Press the OK button. HEC-SSP will create a new empty project.
Import Data from HEC-DSS
The data for this project will be brought in from a DSS file, linked above in a zip file, containing folder Initial Workshop Files, or in the workshop folder on the VM. Download the zip file Initial_Coincident_Frequency.zip to your working location, and extract the files. (You'll find DSS and XLS* files.)
- Select Data | New | Using Import Wizard….
- Leave the defaults on the Create New Data Set screen and click the Next> button.
- Leave the Data Source set to HEC-DSS. Click the Next> button.
- Click the ellipsis button (
 ) to the right of the Selected DSS File to select the DSS file.
 - Select the DSS file named “phillippi flow and rain data.dss” from the Initial Workshop Files. The table in the Data Wizard should now contain two records, as shown in the photo below.

- Double left click on each record to add them both to the list at the bottom of the Data Wizard, and click the Next> button.
- Check that the Review Data screen looks reasonable and that there are no obvious errors in the data import.
- Click the Import button.
Examine the Data
The data records imported to the study are:
- Annual maximum 3-day precipitation in inches for the Hall, WV precipitation gage
- Mean daily flow values in cfs for the Tygart River at Phillippi, WV
Before creating an analysis, examine the data. To visualize one of the datasets, right click on it and click Plot or Tabulate. To visualize both datasets together, hold the Ctrl or the Shift keys to select both datasets, then select Data | Plot or Data | Tabulate .
Create a General Frequency Analysis for 3-day precip at Hall
To perform a coincident frequency analysis, we assign the more influential variable as variable A (here, interior precipitation at Hall) and use an annual maximum frequency curve to represent it.
- Create a General Frequency Analysis using the Hall precipitation data:
- Right click on the General Frequency folder in the Study Tree and select New to open the analysis editor.
- Enter "Hall Rainfall" as the analysis Name.
- From the Data Set drop-down menu, select the “PHILLIPPI-HALL-PRECIP” dataset.
- On the General tab:
- Select “Analytical” for the Distribution.
- Select “Do Not Use Log Transform” in the Log Transform panel.
- Select “Calendar Year (starts Jan 1)” as the Year Specification.
- Select the Median (A and B = 0.3) plotting positions.
- On the Analytical | Settings tab:
- From the Distribution drop-down menu, select PearsonIII from the dropdown box.
- Press the Compute button, then OK on the dialog showing successful compute.
- Examine the Tabular Results and Plot tabs.
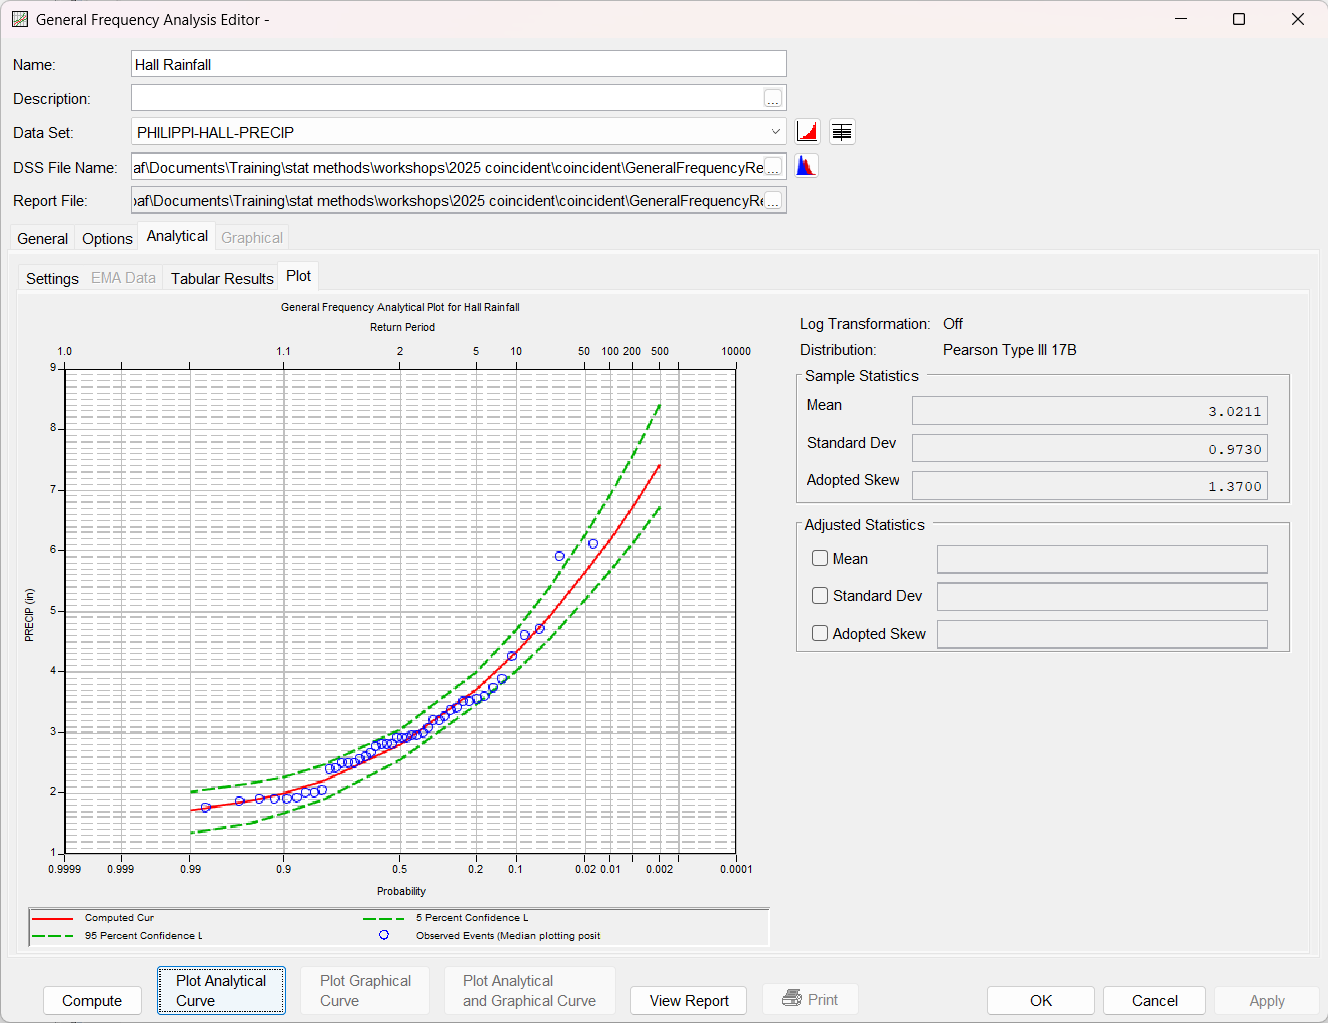
Question 1: What do you think of this distribution for annual maximum 3-day precipitation?
It is a reasonable fit for the data set. The largest two events plot above the fitted frequency curve, so the distribution implies they are less frequent than the sample suggests. (Based on the fitted distribution, a 3-day precipitation of this magnitude is estimated to be less frequent than its occurrence of twice in 44 years would suggest.) You may try other distributions such as GEV, which is found lower in the distribution drop-box, under L-moments. Go forward with whichever distribution you decide.
- Try other distributions and examine the fit and logic.
- Hit OK to close the analysis. On the File menu, select Save to save the study.
Create a Duration Analysis for Tygart River flow
We assign the less influential variable as variable B (here, it is the Tygart River flow) and use a daily duration curve to represent it. Use of a duration curve in the coincident frequency analysis implies that the two variables do not necessarily experience their annual peaks at the same time, and so daily, rather than annual, probabilities are used for this variable. (The implication is that the location is experiencing "any given day" for that variable.)
- Create a Duration Analysis curve of the Tygart River daily flows:
- Right click on the Duration folder in the Study Tree and select New to open the analysis editor.
- Enter "Tygart at Phillippi" as the analysis Name.
- From the Data Set drop-down menu, select the “TYGART-PHILLIPPI-FLOW” dataset.
- Leave all options on the default values.
- Press the Compute button, and then OK on the dialog showing successful compute.
- Examine the Results tab. Make sure you examine both the Tabular Results and Plot sub-tabs.
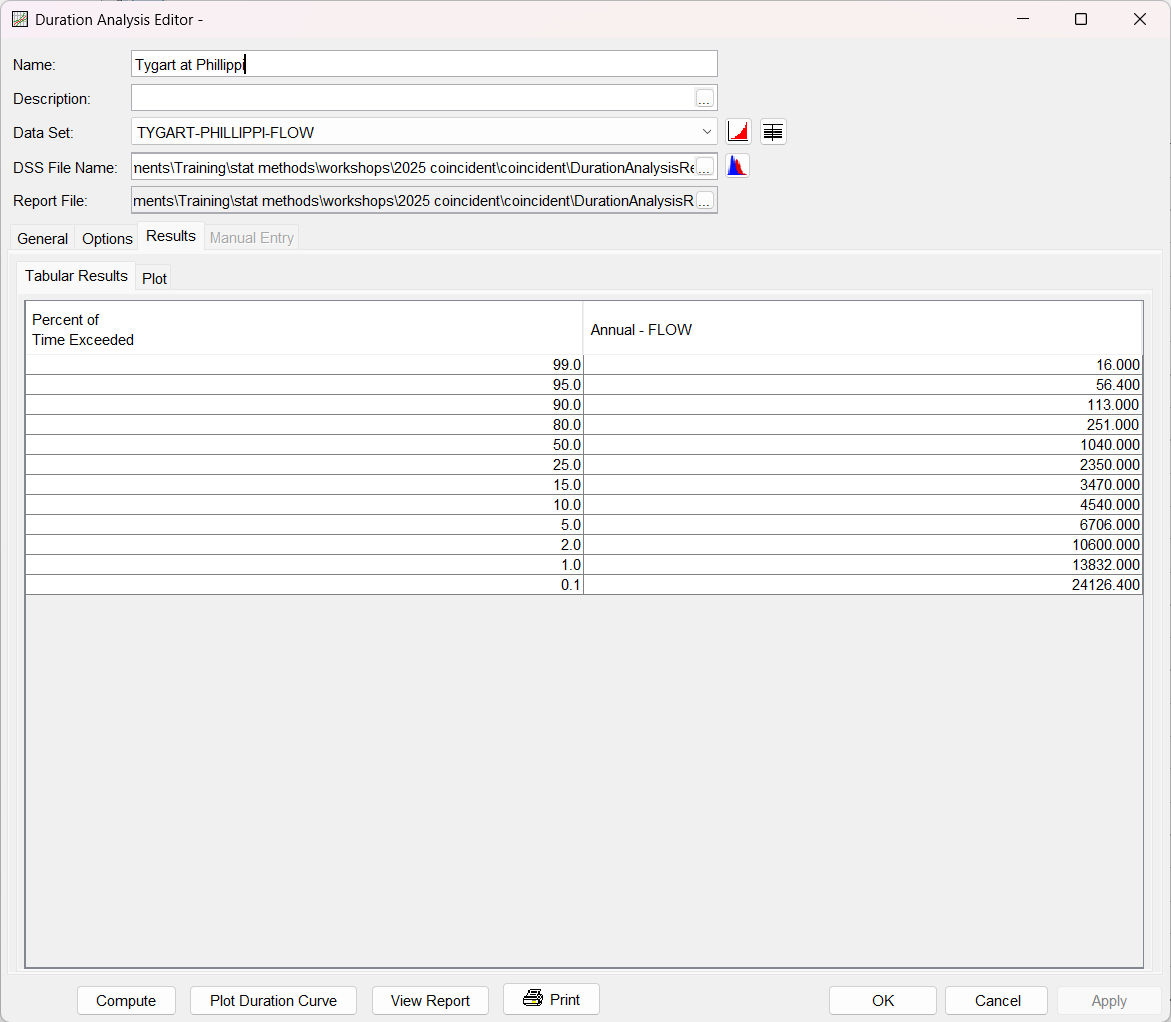
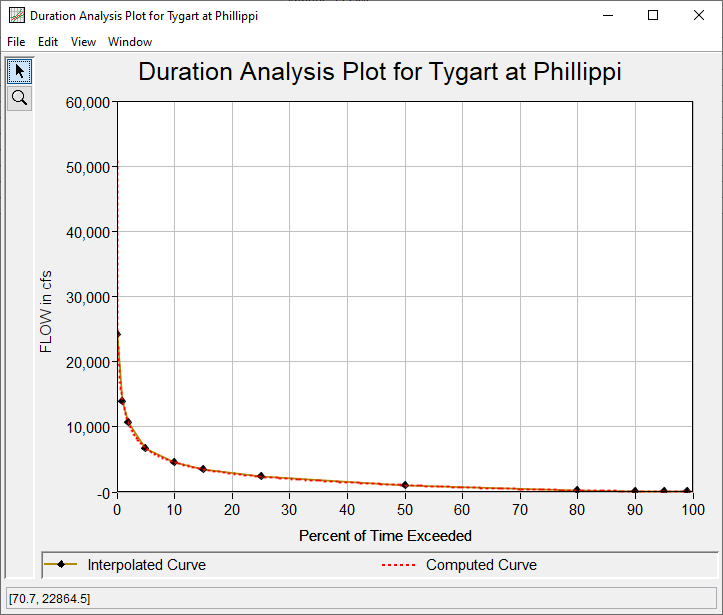
Question 2: How do you interpret the choice to use a duration analysis for Tygart flow?
The duration curve for daily Tygart River flows shows the percentage of days that a flow value is exceeded. For a date far in the future, these values can be treated as the likelihood of the value on some day in the future. Daily, rather than annual, probability is used because we are not assuming that a flood event on the Tygart River will occur/coincide with the annual peak rainfall at Hall, WV.
- Hit OK to close the analysis. On the File menu, select Save to save the study.
Create a Coincident Frequency Analysis for interior pond stage
Next, we need to include the response of variable C, the peak pond stage, to the precipitation event and the river flow exterior to the levee. HEC-HMS model runs have been performed to evaluate an interior pond and pumping station for many combinations of interior 3-day rainfall in inches and exterior Tygart River flow in cfs. The results of these model runs, called response curves, are shown below. This data is stored in spreadsheet “Phillippi Data tables 2024.xlsx”, to be copied into HEC-SSP when needed.
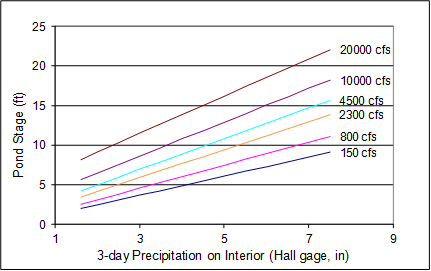
At this point, we have all the ingredients for a coincident frequency analysis, assuming that the interior and exterior variables (variables A and B) do not necessarily experience their annual peaks at the same time, and that the values of coincident occurrences are independent (uncorrelated). After performing an initial coincident frequency computation with these assumptions, we will examine these assumptions more closely.
- Create a coincident frequency analysis to develop a stage frequency curve of the interior pond.
- Right click on the Coincident Frequency folder in the Study Tree and select New to open the analysis editor.
- Enter "Phillippi Coincident" as the analysis Name.
- On the General tab:
- Leave the radio button for “A and B can be Assumed Independent (Marginal Frequency Curve for A)” selected.
Under Variable B, set the Number of Index Values to 6 by typing 6 or by hitting the up and down arrows.
- Under Output Labeling, enter "Pond stage" as the Data Name and "feet" as the Data Units.
- On the Variable A tab:
- Select Existing Study Analysis, and from the dropdown list, choose the general frequency analysis for the Hall rainfall you created above. The Variable A Frequency Curve table will be populated with the results from the general frequency analysis.
- On the Variable B tab:
- Under Import Duration Curve, from the dropdown list, choose the duration curve for Tygart flow you created above. The table below will be populated with results from the duration curve.
- In the Develop Probabilities from Duration Curve panel, choose the radio button Define from Index Points.
- In the Index column of the table, enter values:
- 150, 800, 2300, 4500, 10000 and 25000
- Click the Generate Table button, and the table will be populated with probabilities.

The figure shows the duration curve divided into the six index values, with the probability assigned to each. Note the probabilities add to 100%, so the total probability theorem can be valid.
- On the Response Curves tab:
- Select Same Variable A for Each Index.
- Right click within the table and select Insert Row(s).
- Enter 11 in the Number to insert field.
- Open the spreadsheet named “phillippi data tables.xls” from the workshop initial files folder. Navigate to the tab named "response curves" and copy the orange cells (B5:H16). Paste the data into the table on the Response Curves tab in HEC-SSP.
- Click the Plot Response Surface button and make sure that the curves look like the figure at the beginning of this section.
- Press the Compute, and OK on the message dialog.
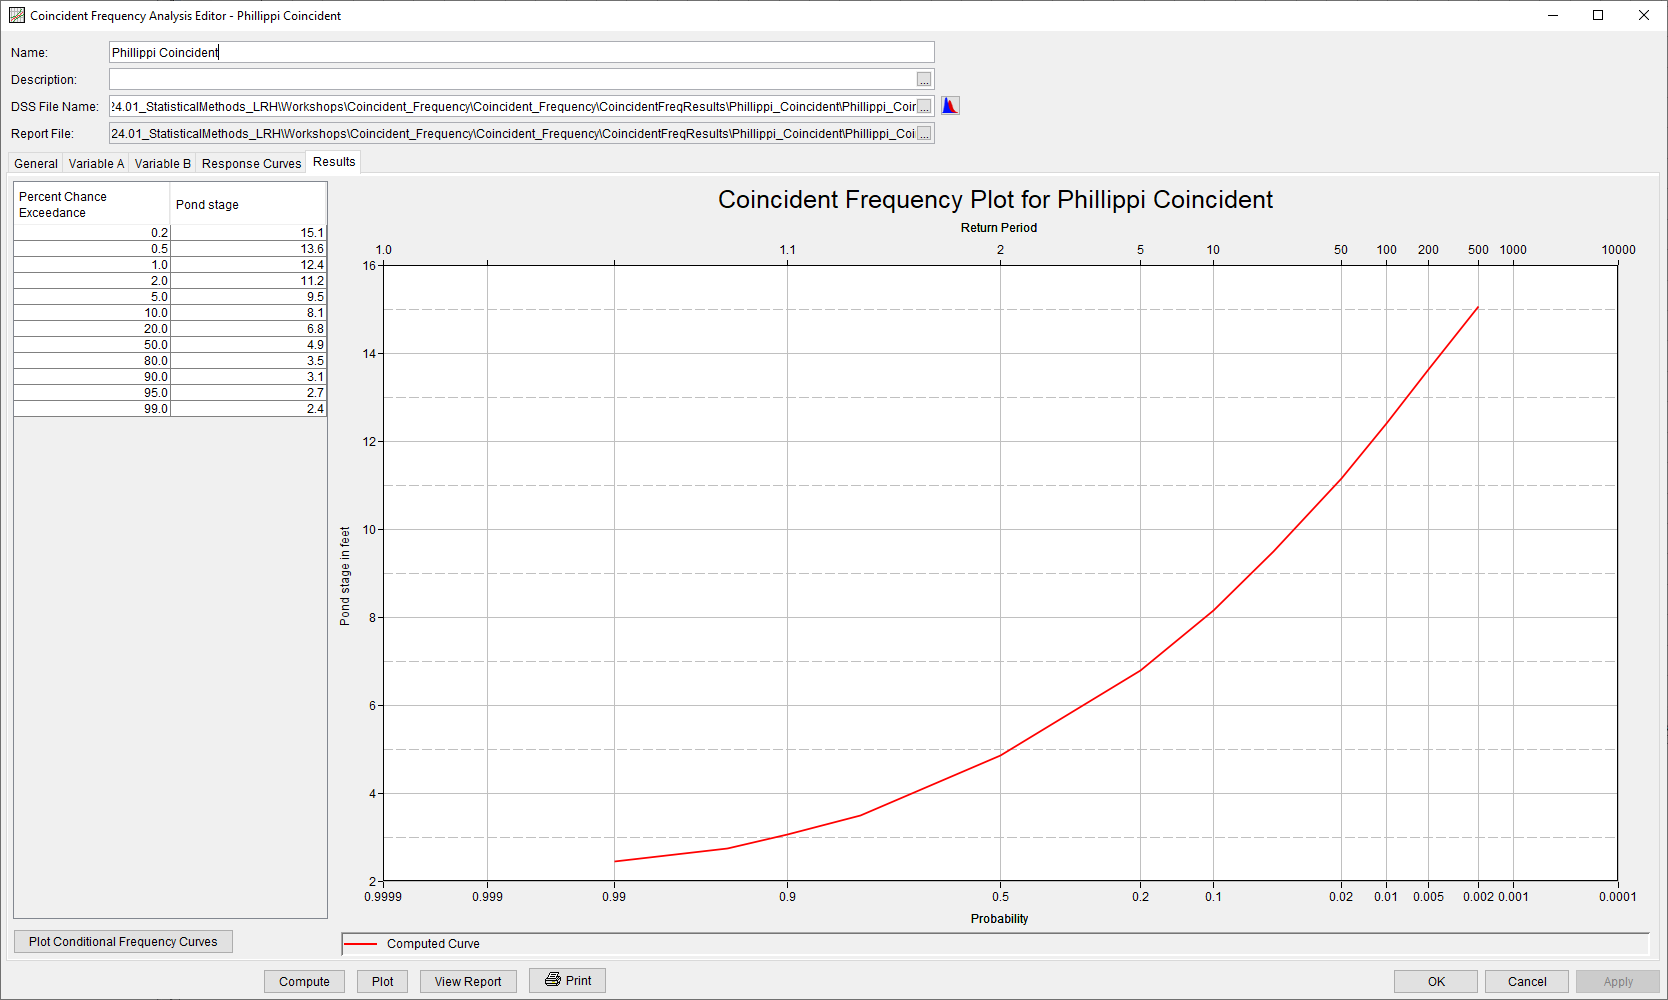
- Examine the Results tab.
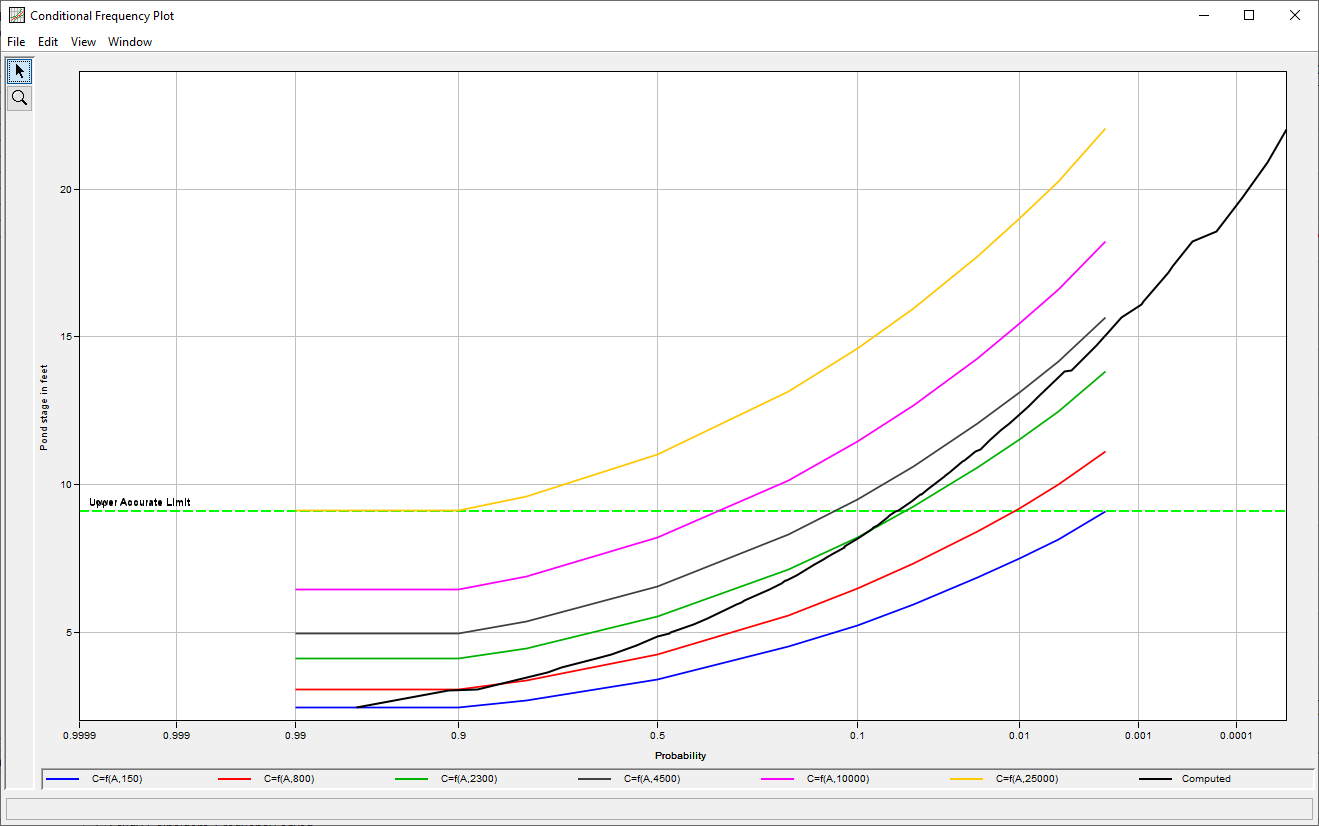
- Click the Plot Conditional Frequency Curves button in the lower left to see the intermediate steps of the Total Probability Method.
The intermediate stages of the coincident frequency analysis, along with the final curve, is shown below. Note the 6 conditional frequency curves for variable C, pond stage, and the final frequency curve computed with the total probability theorem. The higher conditional curves have less probability, and so have less impact on the final curve.
Final Workshop Files
Continue to Task 2 - Coincident Frequency by Monte Carlo Simulation.
