This R Notebook is the first part in a two-part workshop on regional frequency analysis. We will be performing regional precipitation frequency analysis for Buford Dam, located 35 miles northeast of Atlanta, Georgia.
This part focuses on preparing the precipitation data into an annual maximum series (AMS). We will be using the Global Historical Climatology Network (GHCN) data. The key steps include:
Identifying GHCN gage stations that fall within our study area.
Downloading GHCN daily precipitation data.
Performing limited quality control.
Extracting annual maxima to derive the AMS for each station.
Plan to spend approximately 30 minutes on this task.
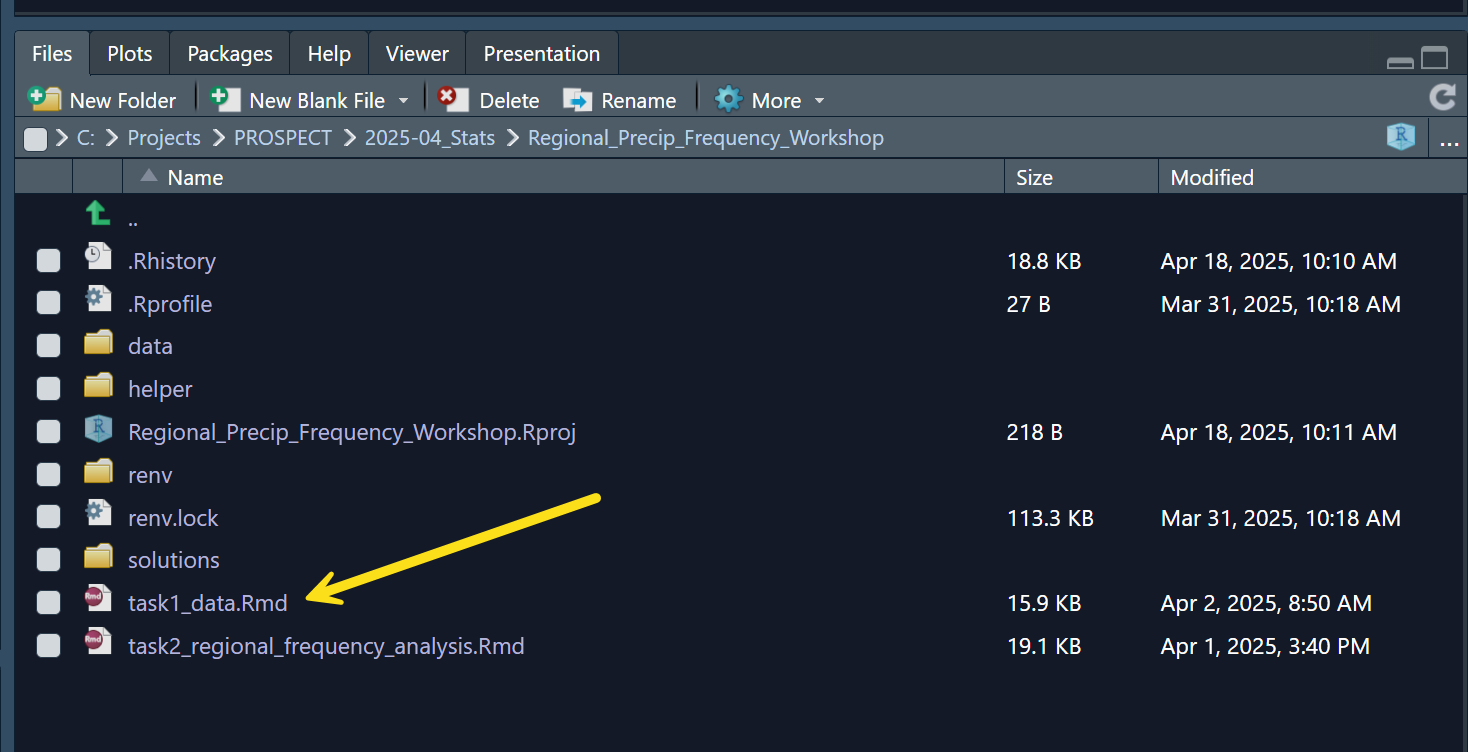
If the R Project is not already open, open it from R Studio by selecting File > Open Project... and selecting the R Project file: "Regional_Precip_Frequency_Workshop.Rproj" included in the project files.
If you are not sure, you can view what project (if any) is currently loaded by viewing the top right of the toolbar in R Studio. You can also open and close projects directly from this drop-down.
In the bottom right under the "Files" tab, you can view all files contained within the R Project.
Select the file "task1_data.Rmd" to begin the task.
All workflow is contained within the .Rmd Notebook. It is recommended to switch to "Visual" mode rather than "Source" mode for a more readable display.
Tip
In some versions of R Studio, there is a known issue where inline chunk execution (using the play button) may run a different chunk of code than the chunk selected when in Visual mode. If this happens, try switching to Source mode then back to Visual mode to fix the issue.