Name the study “B17C_Workshop” and provide an adequate description.
Point HEC-SSP to create the new project in an appropriate location.
Ensure the Unit System is set to English and the Coordinate System is set to Geographic.
Click OK.
Import Data to HEC-SSP
Now you need to import the annual maximum series for Big Sandy River at Bruceton, TN. This data set will be used to perform the subsequent analyses. You will import a data set from an existing DSS file.
Click Data|New|Using Import Wizardto open thenewData Importer Wizard.
Enter “BigSandyRiver” as the name and provide an adequate description.
Click Next.
Change the Sourceto HEC-DSS and click Next.
Click the ellipsis button () within theSelected DSS Fileentry field.
Within the pop up window, navigate to the “Big_Sandy_River_AMS.dss” file. ClickOpento select this file.
This will cause the contents of the selected DSS file to populate within the table listing selectable data sets.
Select the Big Sandy River annual maximum series.
This should correspond to the DSS record: "/BIG SANDY RIVER/BRUCETON, TN/FLOW-ANNUAL PEAK//IR-CENTURY/USGS/”.
Double click on this record to add it to the window at the bottom of theData Importer.
ClickNextand review your data one last time.
When ready, clickImportto to import the data set and return to the main HEC-SSP desktop.
Click theSavebutton () to save the study.
You should notice that a new record was added to the Study Explorer window under Data that contains the Big Sandy River records.
Examine the data by plotting and tabulating.
Question. How many annual maximum flows are contained within this data set? Are there are any missing periods?
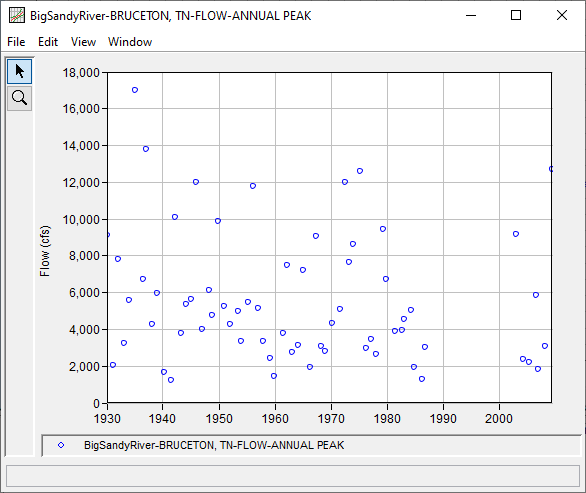
65 annual maximum flows are contained within the Bruceton data set. These annual maximum flows span water years (WY) 1930 - 2009, as shown in the following plot. However, there is a 14 year gap in the record from WY 1988 - 2002.
Question: When do annual maximum flows tend to occur at this location? Hint: use the Right Click | Year-Over-Year Plot capability to examine this aspect of the data set.
Annual maximum flows can occur at any time of year at this location, as shown in the following Year-Over-Year plot: