Download PDF
Download page Record Extension Analysis Results.
Record Extension Analysis Results
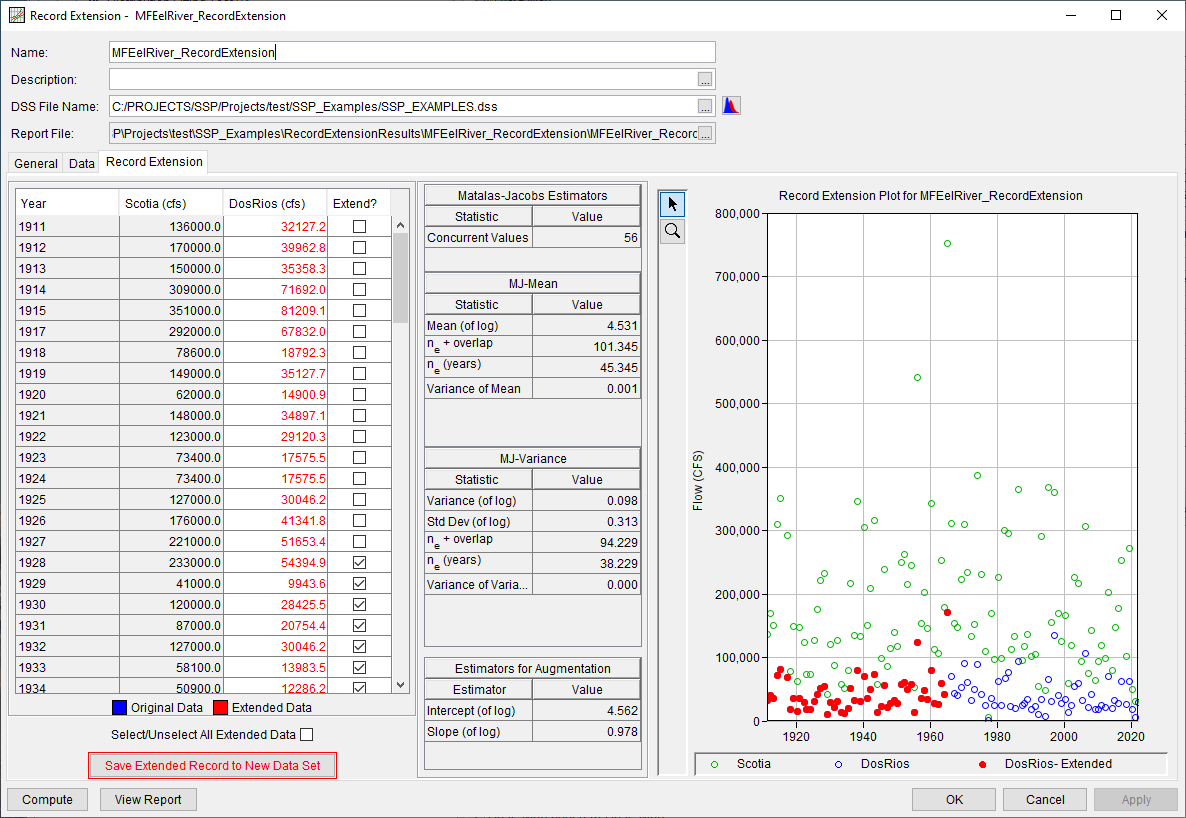
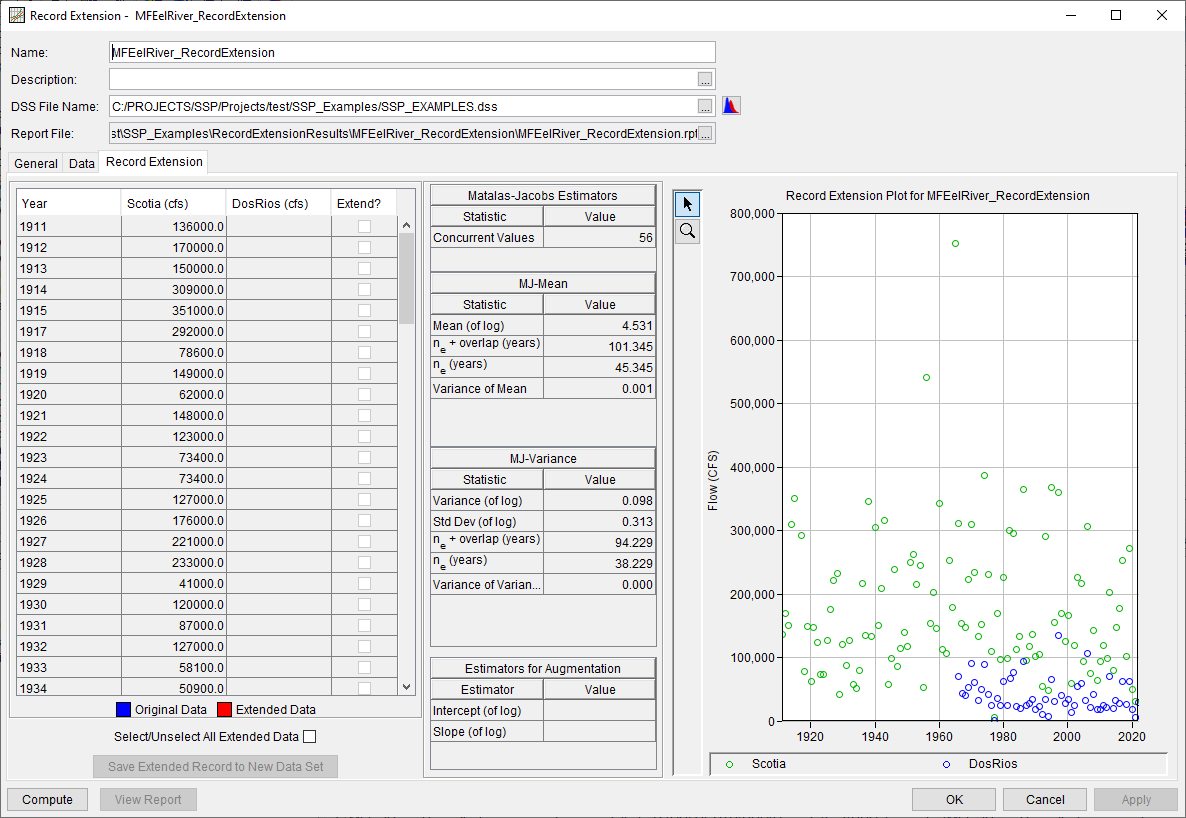
This section describes results that are available for the Record Extension Analysis. The Record Extension tab will contain a Time Series table, a table of Statistics, and a Plot showing the input and extended record, as shown in Figure 1.
Time Series
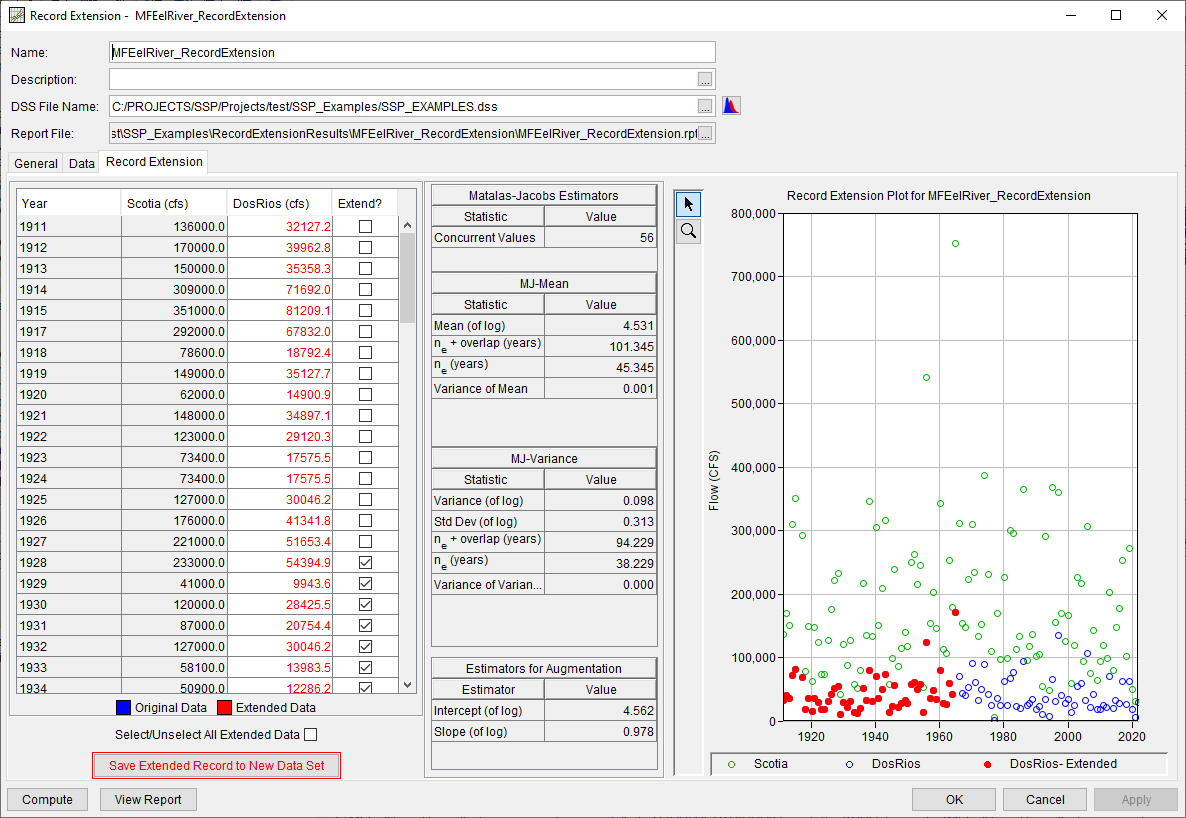
A table containing the Primary, Secondary, and Extended records (if computed) is shown on the left-hand side of the Record Extension tab. Prior to a successful compute, this table will only contain the Primary and Secondary records. Following a successful compute, this table will also contain the Extended record. A column containing checkboxes (titled "Extend?") is included within this table. Only those rows that have been selected will be extended when outputting results to a new time series.
When using the MOVE.1 computation method, the checkboxes for all rows in this table corresponding to extended dates will be automatically selected.
When using the MOVE.3 (Bulletin 17C) computation method, only the checkboxes corresponding to the ne extended dates (depending upon the Years Option on the General tab) will be automatically selected.
A Select/Unselect All Extended Data button is included at the bottom of this table. Clicking this button will automatically select the entire extended record or deselect the entire extended record.
When using the MOVE.3 (Bulletin 17C) computation method, be careful selecting a different portion of the extended record to save to a new data set. The Estimators for Augmentation (i.e. intercept and slope) were computed using the ne years (depending upon the Years Option on the General tab). As such, choosing a different portion of the extended record will not result in the Matalas-Jacobs estimators being reproduced within the extended record. It is recommended that the user selects the default extended record when saving to a new data set.
Save Extended Record to New Data Set
The Save Extended Record to New Data Set button can be used to save the extended record to a new data set for use within another analysis (e.g. Bulletin 17, General Frequency, Volume Frequency, etc). This button is located at the bottom of the Record Extension tab, as shown in Figure 2.
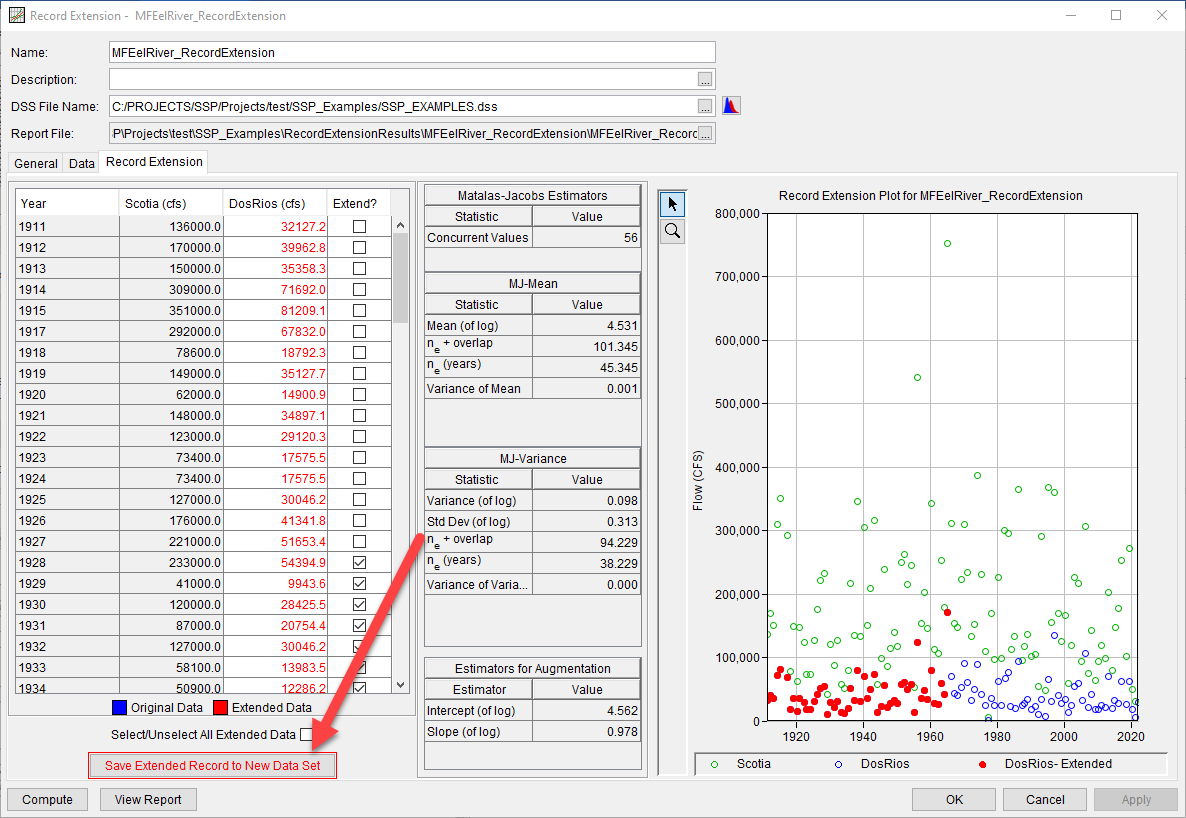
The Save Extended Record to New Data Set button will only be active following a successful compute. Following a successful compute, this button will be highlighted in red.
Once the extended record is saved to a new data set, it can be used to compute updated flow-frequency information. An example of this type of application is shown here: Fit an LPIII Distribution to the Extended Data and Compare the Results.
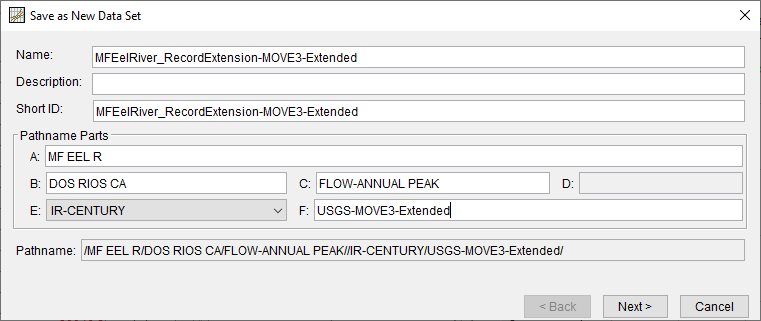
When the Save Extended Record to New Data Set is clicked, a dialog will be presented allowing for the definition of a Name, Description, Short ID, and DSS Pathname Parts for the new data set, as shown within Figure 3.
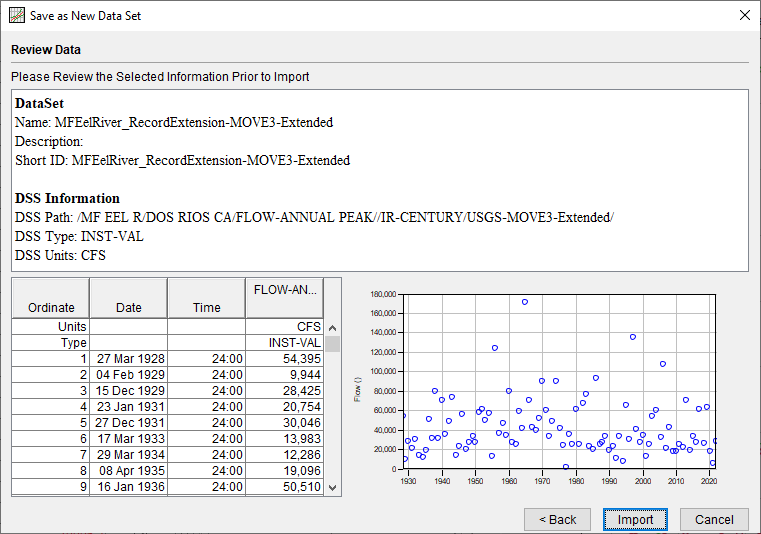
Upon clicking the Next button, a Save As New Data Set Summary dialog will be shown allowing the user to review the metadata of the new data set as well as a tabulation and plot of the data that is about to be imported, as shown in Figure 4.
Statistics
Several tables detailing the Matalas-Jacobs Estimators (MJ-Mean and MJ-Variance) and the Estimators for Augmentation extended record is shown in the middle of the Record Extension tab. The Matalas-Jacobs estimators are improved estimates of the mean and variance of the Secondary data set based upon the Primary data set. The Estimators for Augmentation include the intercept and slope of the linear relationship that was used to compute the extended record.
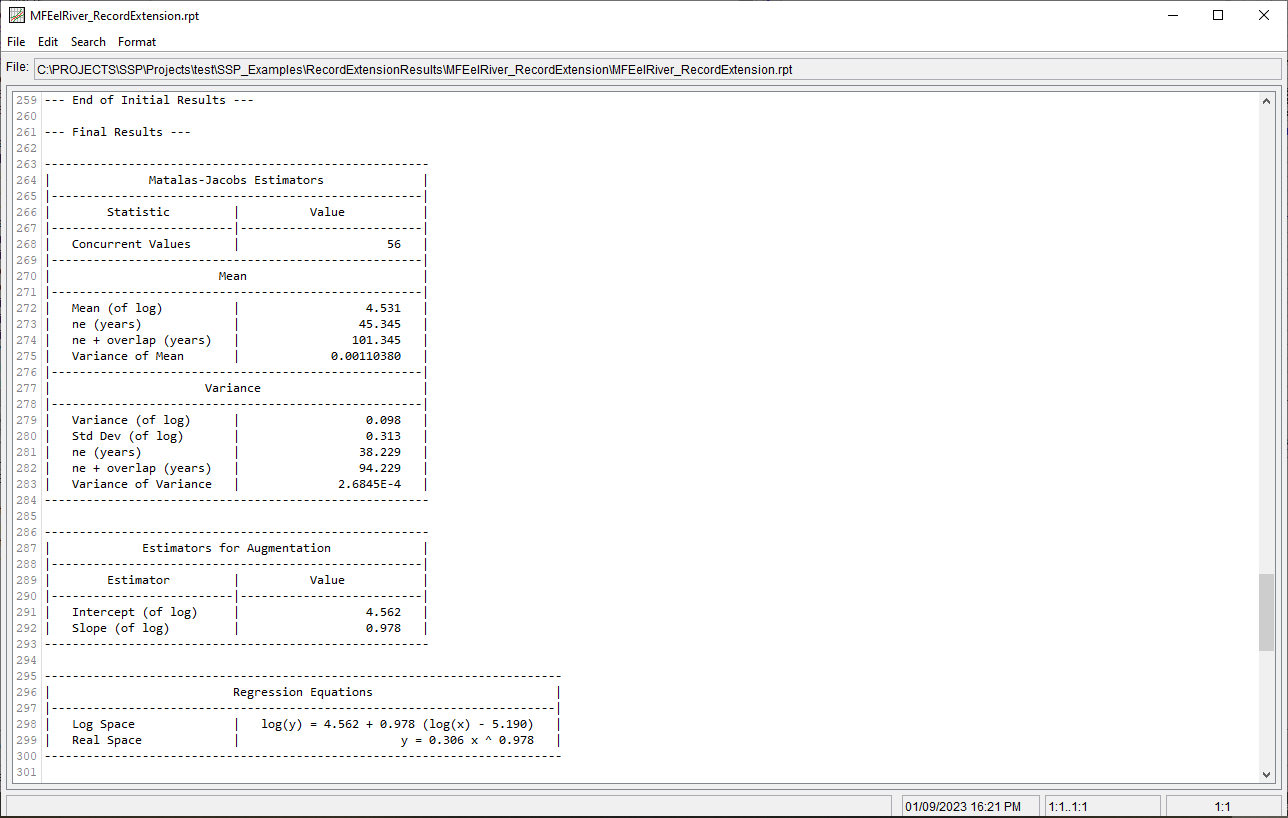
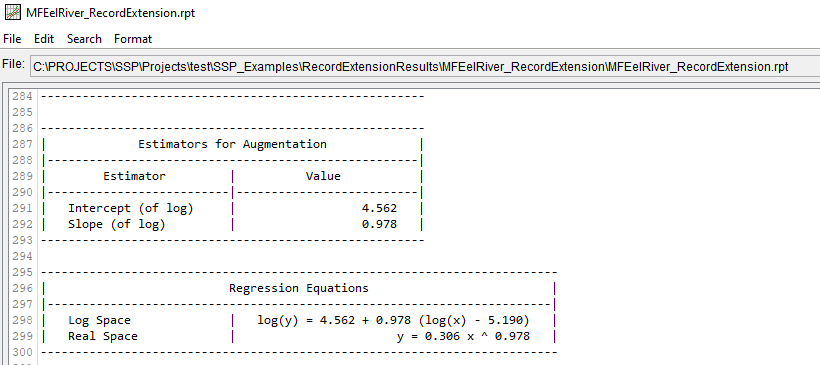
The intercept and slope of the linear relationship that are reported within the Estimators for Augmentation table are in log10 space. The real-space-equivalent parameters are noted in the Report file, as shown in Figure 5.
Plot
A plot of the Primary, Secondary, and Extended records (if computed) is shown on the right-hand side of the Record Extension tab. Prior to a successful compute, this plot will only contain the Primary (green open circles) and Secondary (blue open circle) records, as shown in Figure 6. Following a successful compute, this plot will also contain the Extended (red solid circles) record, as shown in Figure 7.
Report File
A report file is created when the Record Extension Analysis computations are performed. The report file lists the input data, user settings, and the results. This file is often useful for understanding how the software arrived at the output. Press the View Report button at the bottom of the Record Extension Analysis editor to view the report file. When this button is pressed, a window will appear containing the report as shown in Figure 8. The input data, selected computational options, and results will be shown within this file.
Different types and amounts of information will show up in the report file depending on the data and the options that have been selected for the analysis.
